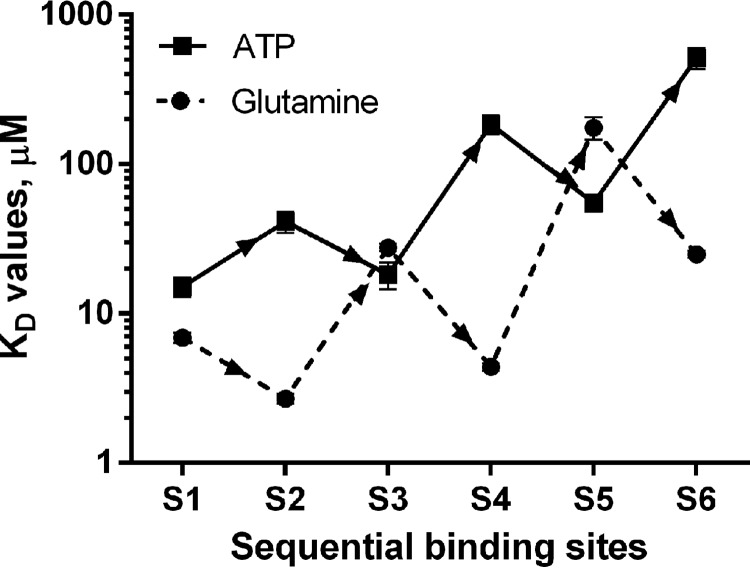
FIGURE 5.
The pattern of alternating positive (synergistic) and negative (antagonistic) cooperative interactions between the sequential glutamine (dashed line) and ATP (continuous line) binding sites of GS. KD values were obtained by fitting ITC data using a binding model of six sequential binding sites.

