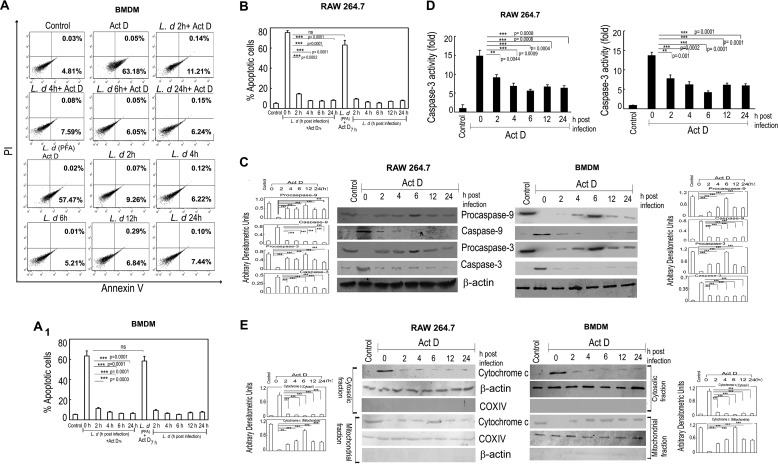
FIGURE 1.
L. donovani infection renders macrophages resistant to apoptosis. A and B, both BMDM and RAW 264.7 macrophages were either infected with L. donovani (L.d) or treated with paraformaldehyde-fixed L. donovani with a parasite/macrophage ratio of 10:1. After incubation for the indicated time periods (0–24 h), cells were either treated with actinomycin D (Act D) (5 μg/ml) for 7 h or left untreated. Cells were then washed and apoptosis were analyzed by annexin-V-tagged FITC-PI flow cytometry. Dual parameter dot plot of FITC fluorescence (x axis) versus PI fluorescence (y axis) is expressed as logarithmic fluorescence intensity for BMDM (A). Quadrants: lower left, live cells; upper left, necrotic cells; upper right, necrotic or late phase of apoptosis; and lower right, apoptotic cells. Individual bar graph represents the mean percentage ± S.D. of apoptotic cells in RAW 264.7 (B) and BMDM (A1). C, L. donovani-infected macrophage cells (both RAW 264.7 and BMDM) were treated with actinomycin D and expression of pro- and active forms of caspase-9 and caspase-3 were detected by immunoblotting. D, whole cell extract (10 μg) prepared from L. donovani-infected actinomycin D-treated cells (both RAW 264.7 and BMDM) were subjected to caspase-3 activity assay as described under “Experimental Procedures.” E, expression of cytochrome c (both cytosolic and membrane fractions) was evaluated in L. donovani-infected actinomycin D-treated RAW 264.7 and BMDM cells by immunoblotting. β-Actin and cytochrome c oxidase (COX) subunit IV were used as internal controls for cytosolic and mitochondrial fractions, respectively. Bands were analyzed densitometrically and expressed as mean ± S.D., n = 3, **, p < 0.01; ***, p < 0.001; ns, nonsignificant; Student's t test.

