FIGURE 3.
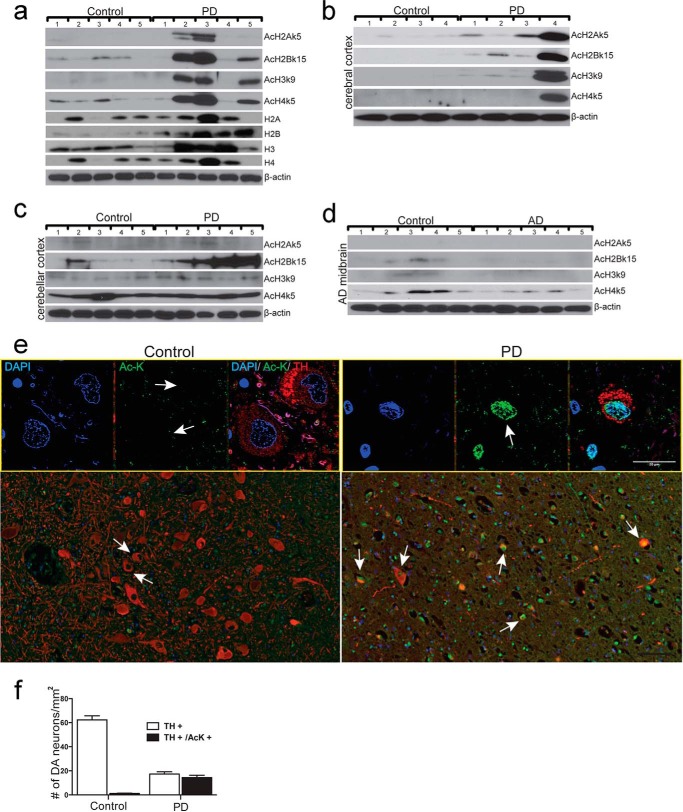
Aberrant up-regulation of histone acetylation in midbrain DA neuron of PD patients. a-c, immunodetection of histone expression and histone acetylation in midbrain (a), histone acetylation in cerebral cortex (b), and cerebellar cortex (c) of PD patients and their matched controls. Numbers on the top of each panel represent different individuals. Expression of H2A, H2B, H3, and H4 and acetylation of H2Ak5 (AcH2Ak5), H2Bk15 (AcH2Bk15), H3k9 (AcH3k9), and H4K5 (AcH4K5) was shown. β-Actin was detected as a loading control. d, immunodetection of histone acetylation in midbrains of AD patients and their matched controls. Numbers on the top of each panel represent different individuals. Acetylation of H2Ak5 (AcH2Ak5), H2Bk15 (AcH2Bk15), H3k9 (AcH3k9), and H4K5 (AcH4K5) was shown. β-Actin was detected as a loading control. e, representative immunofluorescent images of histone acetylation in midbrain of PD patients. TH+, DA neurons (red); Ac-K+, acetylated lysine (green). Cell nuclei are stained with DAPI (blue). Low magnification (scale bar = 100 μm) in the lower panel and high magnification (scale bar = 20 μm) in the upper panel are shown. White arrows, DA neurons with acetylated lysine signal. f, quantitative analysis of the number of DA neurons (TH+) and DA neurons with histone acetylation positive signal (TH+/Ac-K+) in midbrains of PD patients and their matched control individuals (Control). The data for each condition represents an average of 10 independent microscopic fields.

