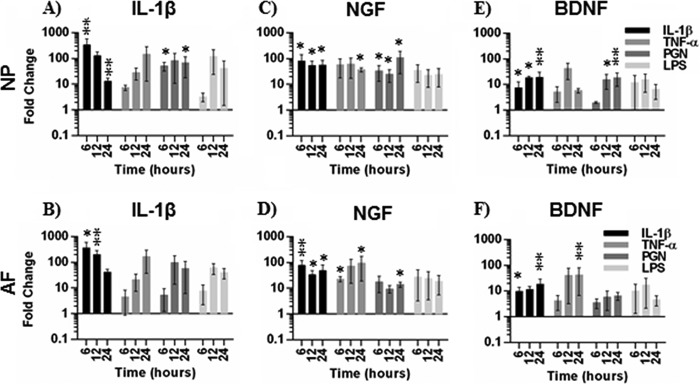
FIGURE 1.
Gene expression in NP and AF after cytokine and TLR agonist treatment. IL-1β (A and B), NGF (C and D), and BDNF (E and F) gene expression is shown in NP (A, C, and E) or AF cells (B, D, and F) after 6, 12, and 24 h of treatment with IL-1β, TNF, PGN, or LPS. Data are presented as -fold change normalized to 18S gene expression and untreated cells using the 2−ΔΔCt method. Data were analyzed using the Kruskal-Wallis test for multiple comparisons of non-parametric data. Data are presented at mean ± S.E., n = 4, except for IL-1β gene expression, where n = 3. *, p < 0.05; **, p < 0.01.

