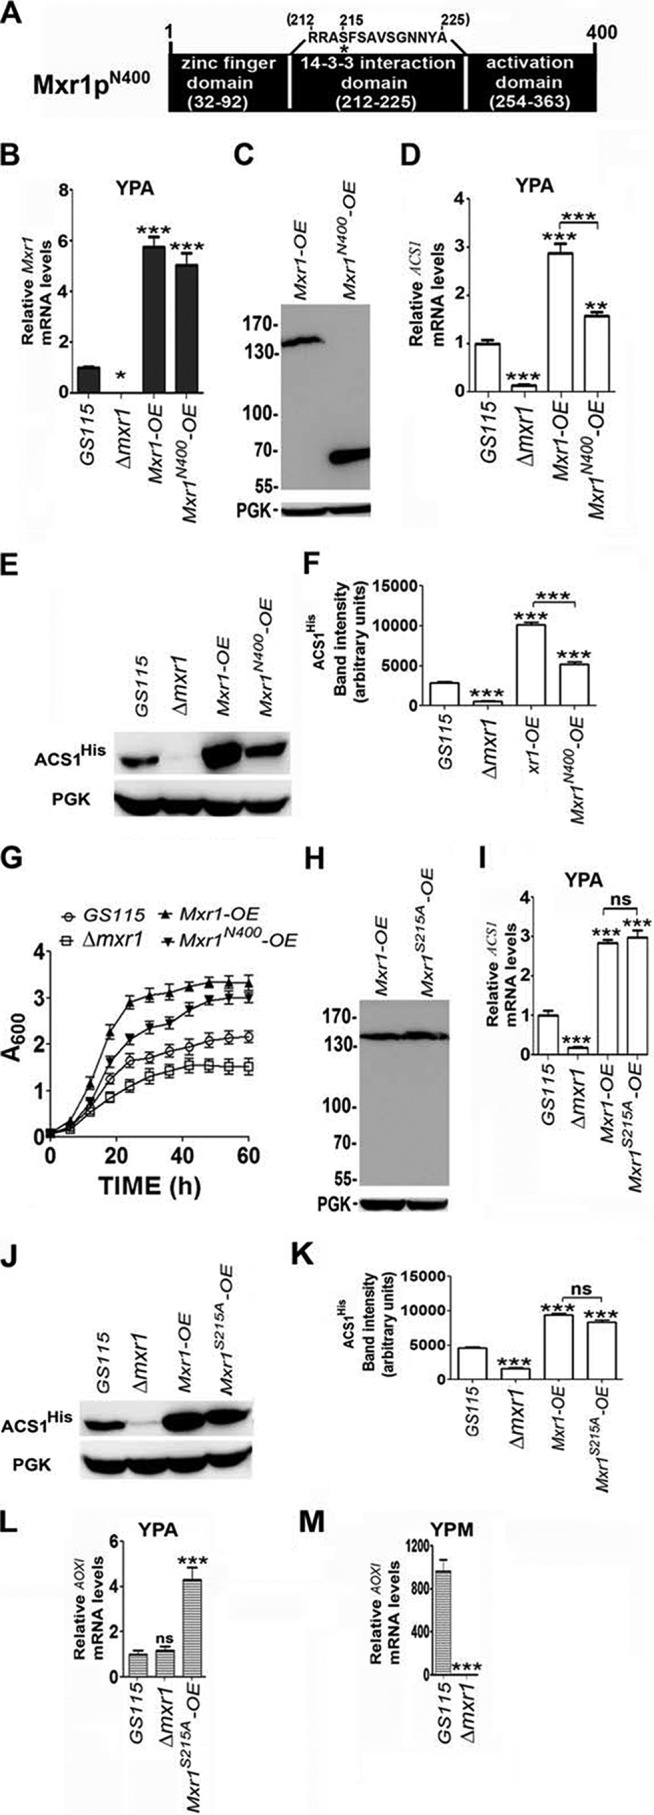
FIGURE 3.

Regulation of ACS1 and AOXI expression by Mxr1pN400 and Mxr1pS215A. A, schematic of the N-terminal region of Mxr1p. Major functional domains are indicated. Serine 215, whose phosphorylation is essential for interaction with 14-3-3 protein, is indicated by an asterisk. B, analysis of Mxr1 expression by qPCR in different P. pastoris strains as indicated. C, analysis of the expression of Mxr1p and Mxr1pN400 by Western blotting using anti-c-myc antibodies in the Pp-Mxr1-OE and Pp-Mxr1N400-OE strains, respectively. PGK served as a loading control. D, analysis of ACS1 expression by qPCR in different P. pastoris strains cultured in YPA. E, Western blot analysis of ACS1His levels in different P. pastoris strains cultured in YPA. PGK was used as a loading control. F, quantification of the data in E. The intensity of individual bands was quantified and expressed as arbitrary units ± S.D. relative to controls. Data are the average of three independent experiments. G, growth curves of different P. pastoris strains cultured in YPA medium. H, analysis of the expression of Mxr1p and Mxr1pS215A by Western blotting using anti-c-myc antibodies in the Pp-Mxr1-OE and Pp-Mxr1S215A-OE strains, respectively. PGK served as a loading control. I, analysis of ACS1 expression by qPCR in different P. pastoris strains cultured in YPA. J, Western blot analysis of ACS1His levels in different P. pastoris strains cultured in YPA. PGK was used as a loading control. K, quantification of the data in J. The intensity of individual bands was quantified and expressed as arbitrary units ± S.D. relative to controls. Data are the average of three independent experiments. L, analysis of AOX1 expression by qPCR in different P. pastoris strains in YPA. M, analysis of AOX1 expression by qPCR in different P. pastoris strains cultured in YPM. Error bars indicate mean ± S.D. *, p < 0.05; **, p < 0.005; ***, p < 0.0005; ns, not significant. One-way analysis of variance followed by Tukey's multiple comparison test was done (n = 3).
