
FIGURE 4.
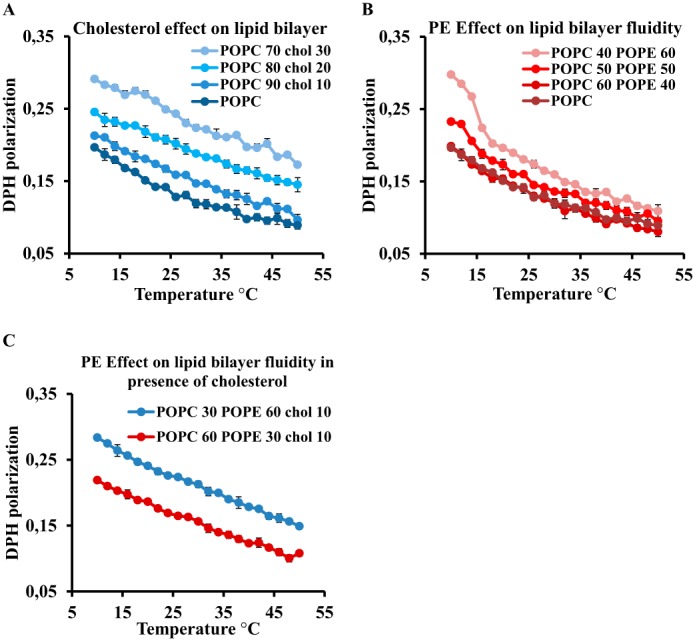
Effect of cholesterol and PE on lipid bilayer viscosity. Membrane fluidity curves were measured by DPH fluorescence polarization in a temperature range from 10 to 50 °C on synthetic liposomes with 0, 10, 20, and 30% (w/w) cholesterol (A) and synthetic liposomes with POPC and POPC with 40, 50, and 60% (w/w) POPE (B) and POPC with 30% (w/w) POPE and 10% (w/w) cholesterol (blue) and POPC with 60% (w/w) POPE and 10% (w/w) cholesterol (red) (C). Error bars indicate S.D. (n = 3).