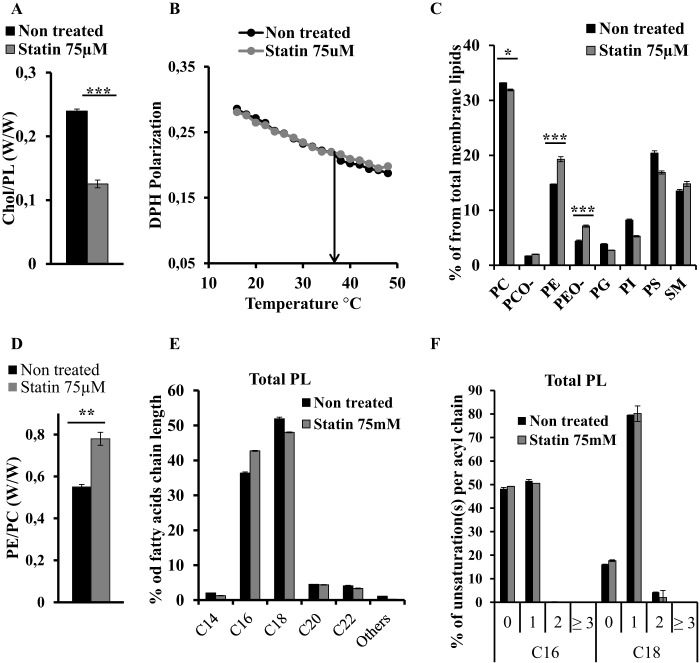
FIGURE 7.
Membrane fluidity maintained by cholesterol and PE in HEK 293T membranes upon statin treatment. Lipid distribution and membrane fluidity of membranes of HEK 293T control (black) and HEK 293T treated with 75 μm simvastatin for 50 h (gray). A, cholesterol (Chol) to phospholipid ratio; B, DPH fluorescence polarization; C, phospholipid distribution; D, PE (including PEO-) to PC (including PCO-) ratio; E, fatty acid chain length distribution; F, unsaturation(s) per acyl chain in main fatty acid chains. Bars represent values normalized to 100% (w/w). Error bars indicate S.D. (n = 3). p values were estimated by Student's t test (n = 3): ***, p < 0.001; **, p < 0.005; *, p < 0.01.

