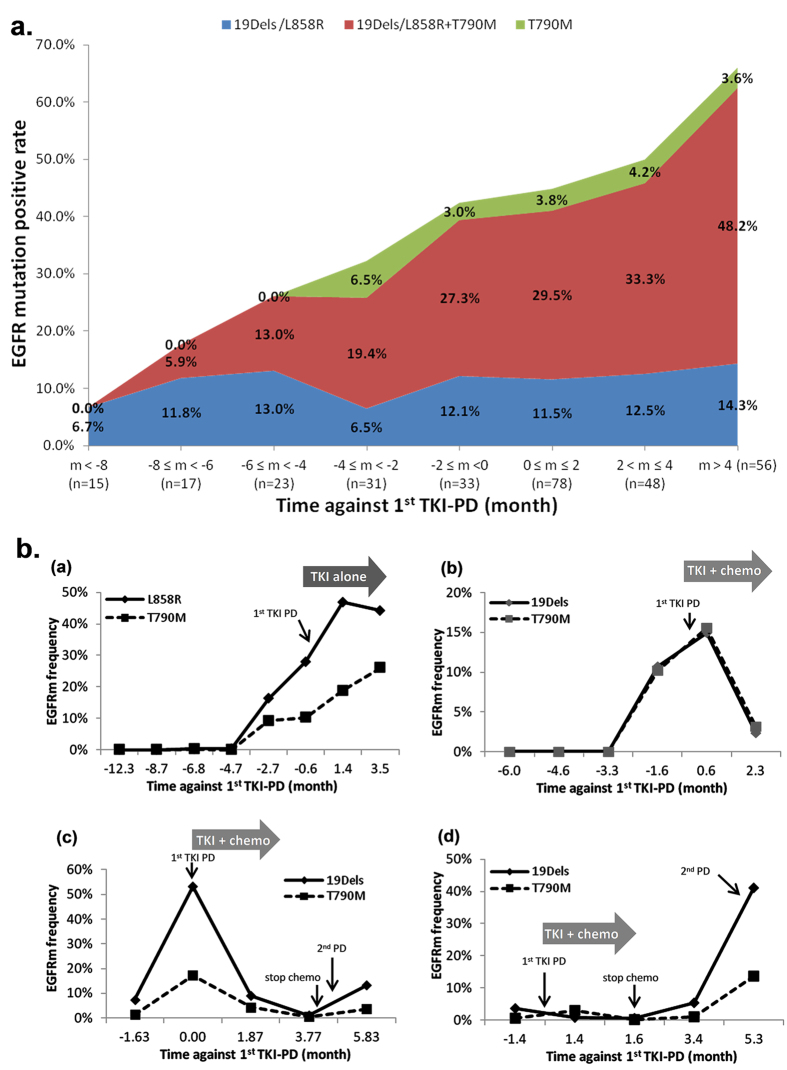
Figure 2. Dynamic detection of EGFR mutant ctDNA in plasma by ddPCR.
(a) Dynamic monitoring of EGFR mutant ctDNA status in plasma from 117 patients before and after EGFR-TKI progression. Patients were grouped every 2 months against 1st PD. Y-axis refers to the percentage of patients positive for the EGFR mutation status, 19Dels or L858R alone (blue), 19Dels or L858R plus T790M (red), and T790M alone (green). “n” refers to the number of patients. (b) Monitoring of response and resistance to clinical treatments by serial measurement of plasma EGFR ctDNA. Emergence of EGFR mutant ctDNA was detected in plasma prior to clinical PD and the mutation incidence increased along with disease progression (a,b) Decreases in EGFR mutant ctDNA in response to post-PD TKI plus chemotherapy was observed in (b–d) Re-emergence and accumulation of EGFR mutant ctDNA were observed after withdrawal of chemotherapy.

