Figure 4.
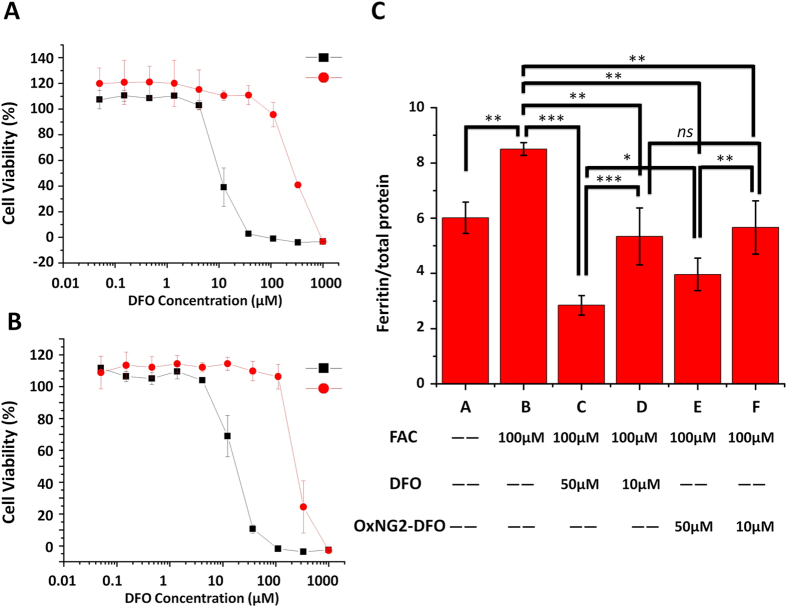
Cytotoxicity of free DFO (black square) and oxNG2-DFO (red circle) on normal J774A.1 cells (A) and in iron overloaded J774A.1 cells (B) after 48 h incubation; a representative set of data is shown for oxNG2-DFO where each data point is presented as the mean ± SD (n = 3). (C) Ferritin reduction assay to monitor iron chelation efficacy of DFO and oxNG2-DFO in iron overloaded J774A.1 cells. Iron overload was induced by 24 h incubation with 100 μM FAC. Cells were then treated with DFO or oxNG2-DFO at 10 μM or 50 μM for 48 h. Cellular ferritin level was measured by a mouse ferritin ELISA assay. Results are normalized to total protein (ng/μg) and presented as mean ± SD (n = 3). “ns” means the difference was not significant. *p < 0.05, **p < 0.01, ***p < 0.001.

