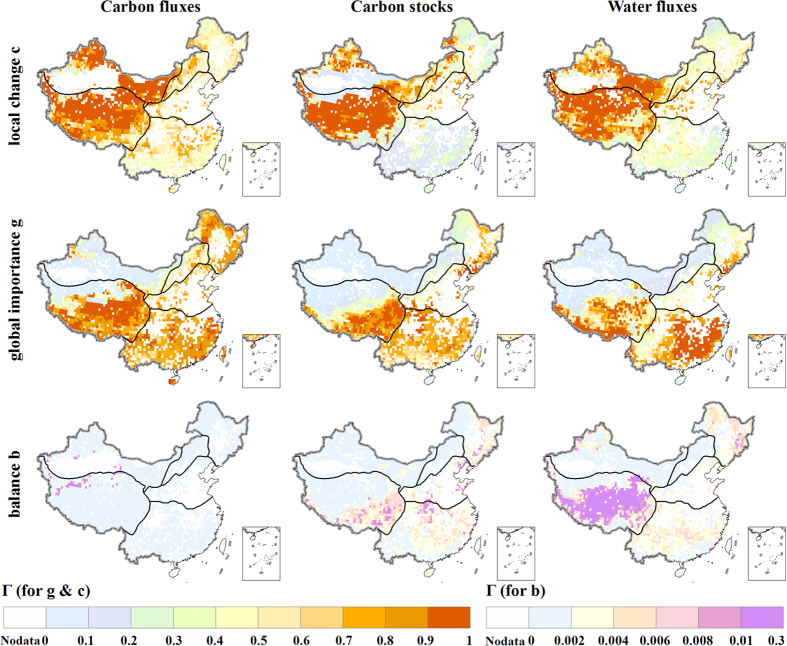
Figure 2. Components (local change, global importance, and balance) of the calculated metric Γ for carbon fluxes (left column), carbon stocks (center column) and water fluxes (right column) at the end of the 21st century under RCP 8.5.
Local change (c), global importance (g), and balance (b) are shown at the top, middle and bottom rows, respectively. We generate the maps and integrate them into Fig. 2 using ArcGIS software.

