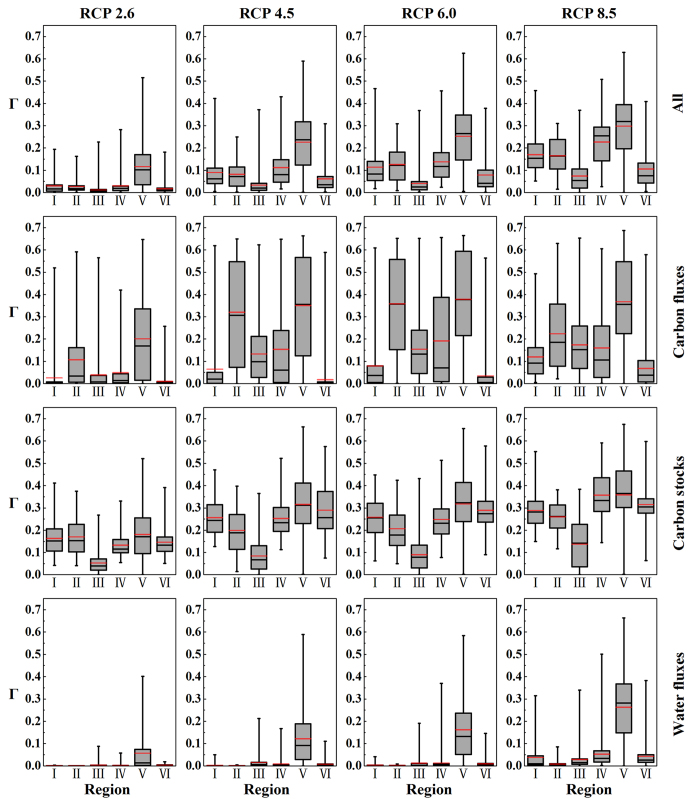
Figure 6. Mean, median and inter-quartile range of the Γ estimates for all variables and variable subsets ‘carbon fluxes’, ‘carbon stocks’, and ‘water fluxes’ in the eco-regions of China at the end of the 21st century under four RCPs (RCP 2.6, RCP 4.5, RCP 6.0, and RCP 8.5).
The shaded box shows the inter-quartile range, the vertical line gives the maximum and minimum, the black horizontal line marks the median, and the red horizontal line marks the mean of the Γ estimates in the region. The eco-regions are shown in Fig. 1. We generate the maps and integrate them into Fig. 6 using Origin software.

