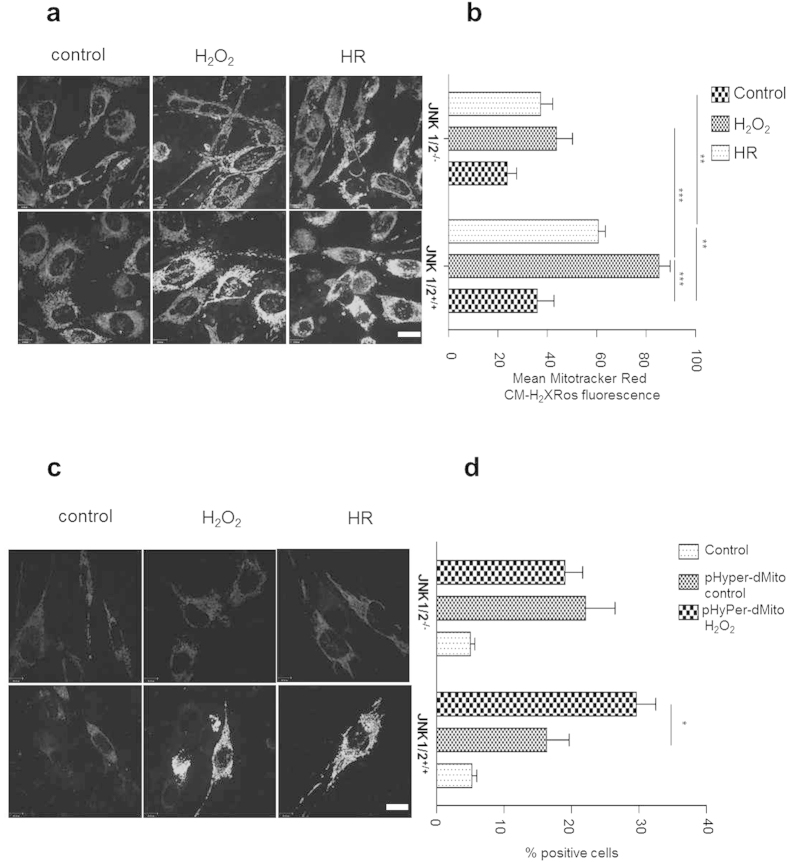
Figure 3. JNK regulates mitochondrial ROS production.
JNK1/2+/+and JNK1/2−/− MEFs were subjected to H2O2 (1 mM, 30 min) or exposed to HR (hypoxia 90 min, reoxygenation 10 min). Mitochondrial ROS were either measured after staining the cells with MitoTracker Red CM-H2XRos fluorescent dye and analyzed by fluorescence microscopy (panel (a) sample Image, panel (b) summary graph) or cells indicated were infected with lentiviral particles harboring either pHyPer-Cyto or pHyPer-dMito expression vectors. HyPer fluorescence was analyzed using confocal microscopy (c). Quantitative analyses were done by FACS where uninfected cells were used as background control (d). Each experiment is repeated at least three times. Size bar = 10 μM. Statistical analysis was performed using t-test or ANOVA (*p < 0.05, **p < 0.01, ***p < 0.001).

