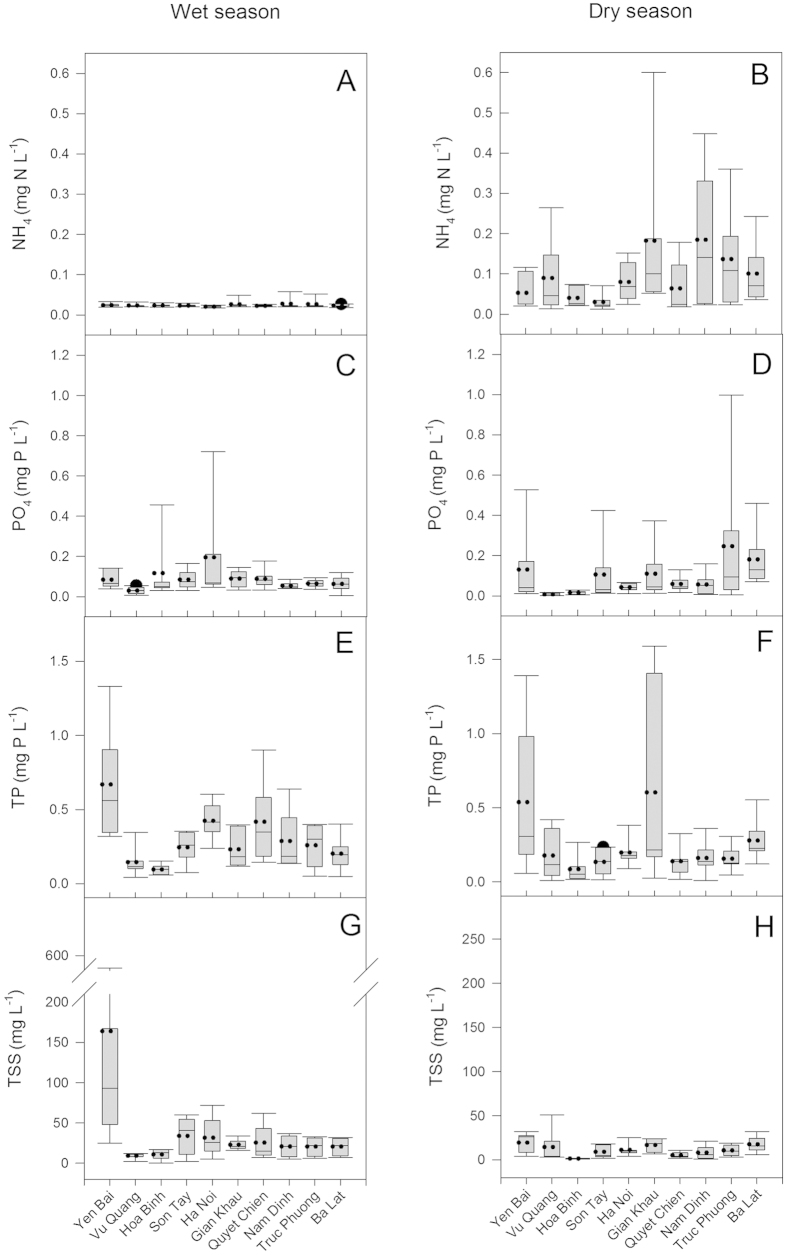
Figure 2. Box plots of NH4, PO4, TP and TSS concentrations for each station for the wet (May to October) and the dry (November to April) seasons for the study period (July 2013 to June 2014).
Left side panels are for the wet season and the right hand side panels are for the dry season. Panels (A,B): NH4, panels (C,D): PO4, panels (E,F): TP and panels (G,H): TSS. Mean (dotted line), median (solid line) and whiskers (error bars) above and below the box indicating the 90th and 10th percentiles are shown.

