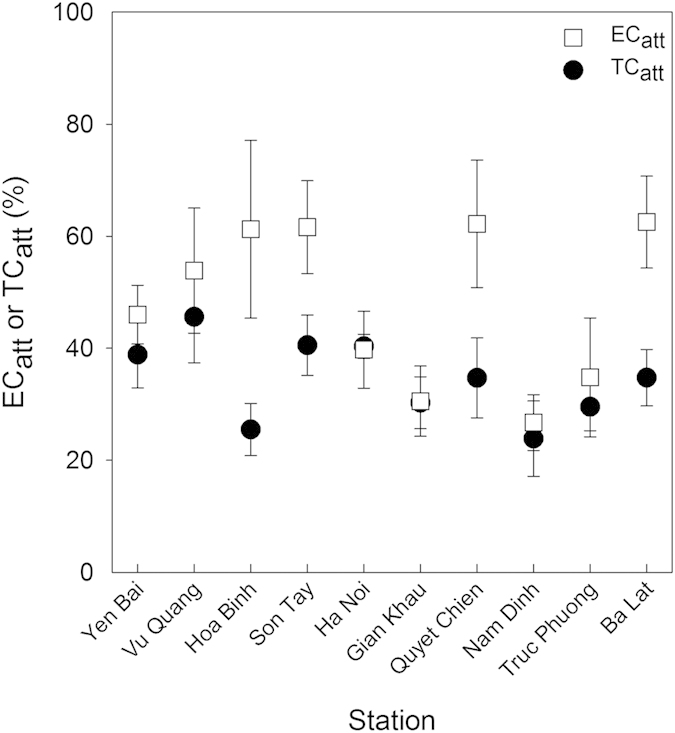
Figure 4. Percentage TCatt and ECatt for each of the 10 stations.

The mean and standard error for each station are given. Filled circles: TCatt, open squares: ECatt.

The mean and standard error for each station are given. Filled circles: TCatt, open squares: ECatt.