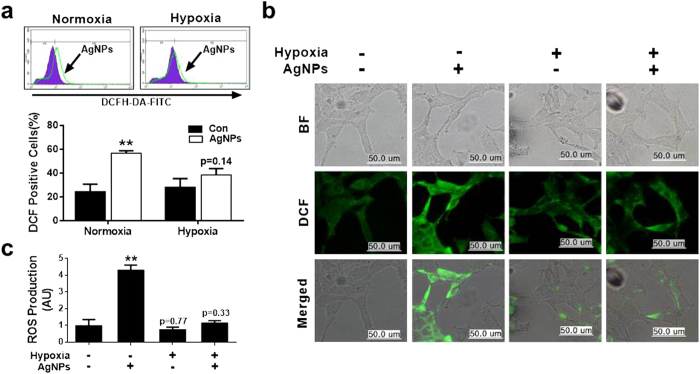
Figure 3. Hypoxia decreased AgNPs-mediated oxidative stress.
(a) AgNPs-treated cells were measured for DCFH-DA-FITC by flow cytometry. M2 represents the population of DCFH-DA-FITC-positive cells. The bar graph indicates the mean ± SEM (n = 3). (b) Representative images of DCFH-DA-FITC in cells treated as described in (a). Treated cells were measured for DCFH-DA-FITC by fluorescence microscopy analysis. Scale bar = 50 μm. (c) Production of ROS measured by flow cytometry as described in (a). **P < 0.01 compared with the control.

