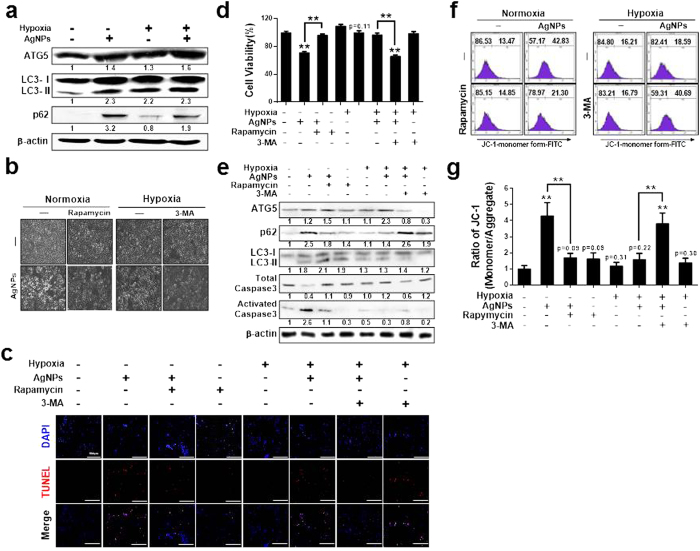
Figure 7. Hypoxia-induced autophagic flux attenuated AgNPs-mediated mitochondrial apoptosis.
(a) AgNPs-treated cells were assessed for ATG5, LC3, and p62 production by western blot analysis. Results were normalized to β-actin. (b) A549 cells were incubated with AgNPs with or without rapamycin and 3-MA under various oxygen conditions. The treated cells were photographed under a light microscope (200×). (c) Representative images of fluorescence microscopy analyses in cells treated as described in (d). Fluorescence microscopy analyses were carried out in triplicate for each sample. (d) Cell viability was measured using the CCK-8 assay. Viability of control cells was set to 100%, and viability relative to the control is presented. (g) The bar graph indicates the J-monomer/J-aggregate formation ratio. *P < 0.05, **P < 0.01, significant differences between control and each treatment group. (e) Western blot analysis of HIF-1α, ATG5, p62, and LC3 from A549 cells treated as described in (b), β-actin was used as a loading control. (f) FACS analysis of MTP conversion in A549 cells treated as described in (b). Cells were treated with JC-1; for normal MTP and low MTP, JC-1 in the monomeric form in the cytoplasm shows green fluorescence. M2 represents the population of JC-1 monomeric cells. g) The bar graph indicates the J-monomer/J-aggregate formation ratio. *P < 0.05, **P < 0.01, significant differences between control and each treatment group.

