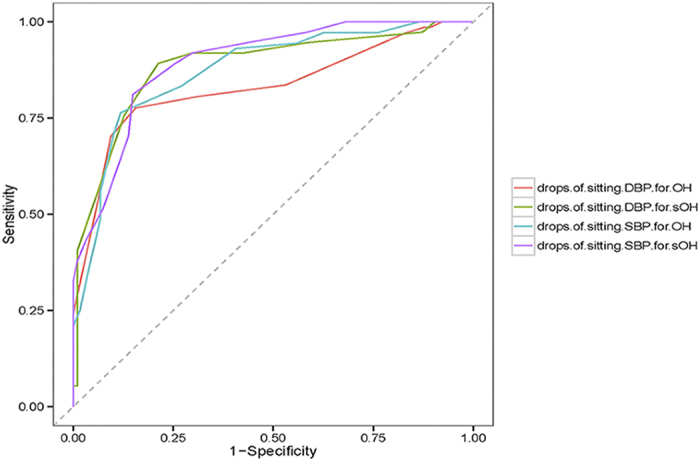
Figure 1. Receiver operating characteristic curves to evaluate the diagnostic performance of the drops of sitting SBP and DBP for OH and sOH in MSA.

Area under color curves indicate a moderate predictive value for drops of sitting SBP and DBP to predict OH and sOH (to predict OH, AUC = 0.874 and AUC = 0.831, respectively; to predict sOH, AUC = 0.894 and AUC = 0.885, respectively).
