Figure 3.
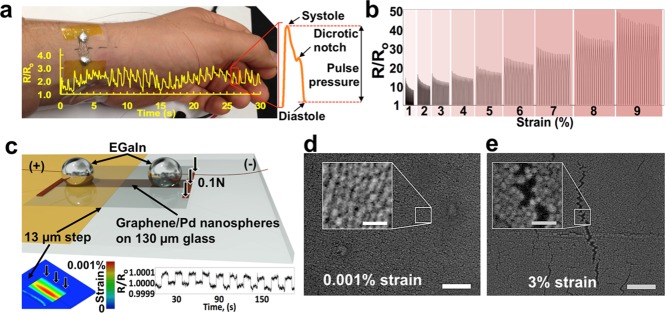
Nanoisland strain sensors. Photograph of the PDMS/PdNI/graphene strain sensor placed atop the radial artery for detection of the pulse (overlaid in figure) (a). Note the high resolution of the pulse pressure-waveform (in the blow-out) with distinguishable systolic and diastolic pressures, the dicrotic notch (aortic valve closure), and other cardiac cycle events. Normalized resistance plot of the PDMS/graphene/PdNI strain sensor stretched cyclically (20 cycles for each strain) to 1, 2, 3, ... 9% strain (b). Schematic diagram of a graphene/PdNI strain sensor used to sense 0.001% tensile strain on the surface of the 130 μm thick glass coverslip (used as a cantilever with the amplitude of deflection equal to 13 μm) (c). Finite-element analysis (FEA) model of the strain on the cantilever surface (left inset). Normalized resistance plot of the graphene/PdNI strain sensor under cyclic tensile strain of 0.001% (right inset). Scanning electron micrograph of the glass/graphene/PdNI strain sensor under tensile strain of ∼0.001% (d). Scale bar: 100 nm. Scale bar in inset: 25 nm. Scanning electron micrograph of the PDMS/graphene/PdNI strain sensor under tensile strain of ∼3% (e). Scale bar: 100 nm. Scale bar in inset: 25 nm.

