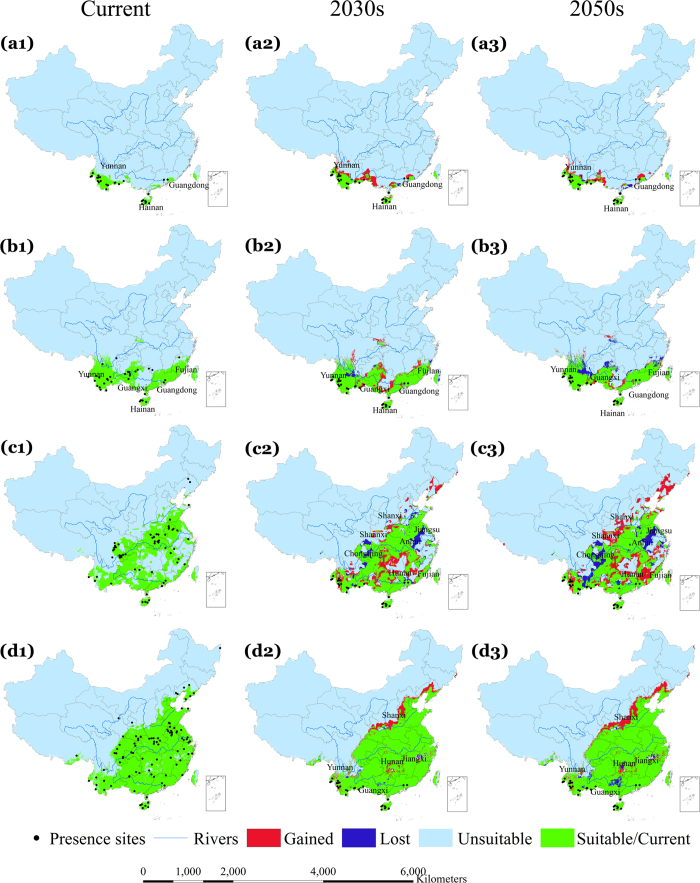
Figure 2. Potential current (suitable and unsuitable) and future (suitable/stable, lost, gained, and unsuitable) environmentally suitable area (ESA) for the four dominant vectors under RCP4.5, the moderate greenhouse gas emission scenario.
Row a1–a3 represent An. dirus, b1–b3 An. minimus, c1–c3 An. lesteri, and d1–d3 An. sinensis. Future predictions are based on an ensemble of predictions from three general circulation models (BCC-CSM1-1, CCCma_CanESM2 and CSIRO-Mk3.6.0). The second and third columns indicate the 2030 s and 2050 s, respectively. The black dots indicate occurrence localities of the respective malaria vectors. Green shaded areas show stable suitable areas, blue shows lost ESA and red shows gained ESA. All the lost and gained areas were calculated based on the current distribution as the reference. Maps created in ArcGIS 10.2 (Environmental Systems Resource Institute, ArcMap Release 10.2, ESRI, Redlands, California).

