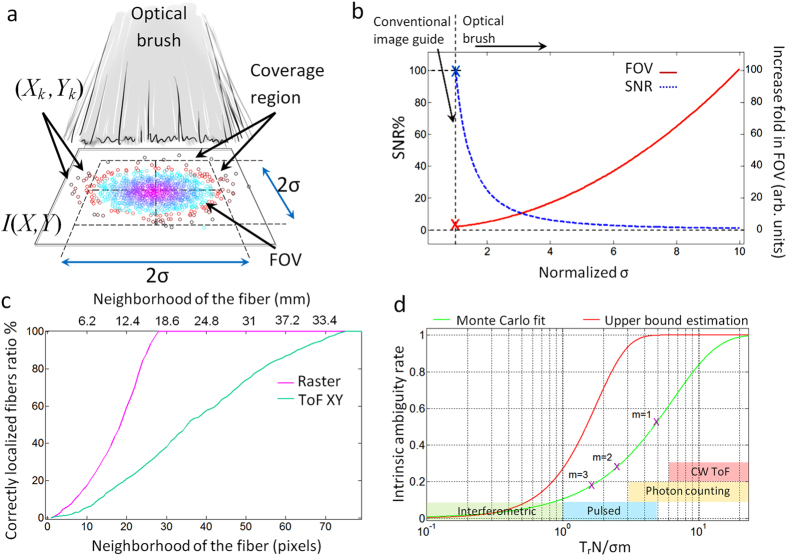
Figure 5. Brush form factor properties and localization accuracy.
(a) Fibers spatial distribution shown by circular markers on the scene plane. The FOV is a function of fibers location distribution, the fibers that are too far apart from the center of the distribution cannot contribute to the signal (red circles) as the sampling rate gets lower and lower moving away from the center. A simplified square coverage region is approximated by FOV. (b) Dynamic of SNR, coverage region and  . Blue dashed curve is the SNR and red solid curve shows coverage region. (c) Localization accuracy comparison of ToF and raster reference with the ground truth. (d) Ambiguity rates estimation based on MC simulation fit and an explicit upper bound estimation. Purple crosses show the ambiguity rate for the brush parameters used in our experiment for m = 1, 2, 3 from right to left respectively. Colored regions show the ambiguity rate range expected for different technologies based on their time resolution assuming a brush with
  .
.

