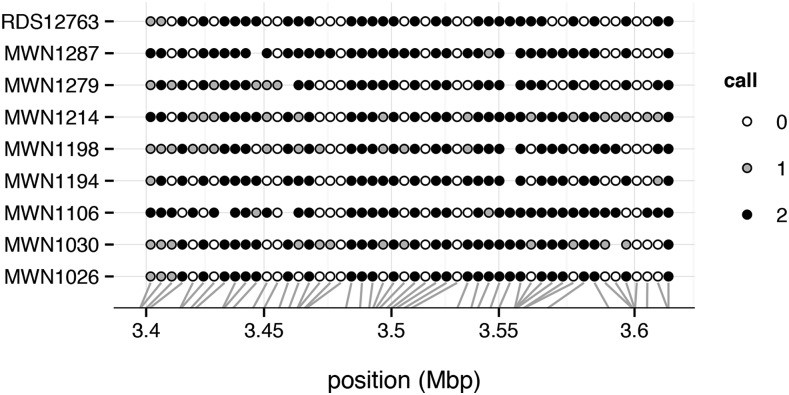
Figure 3.
Dotplot representation of genotypes among nine wild-caught mice on proximal chromosome 19 (from Yang et al. 2011). Genotype calls are coded as counts of the reference allele, and points are colored according to genotype call. Blank spaces indicate missing calls. Markers are plotted with constant spacing in the main panel; gray lines indicate physical position along the chromosome in megabases (Mbp).

