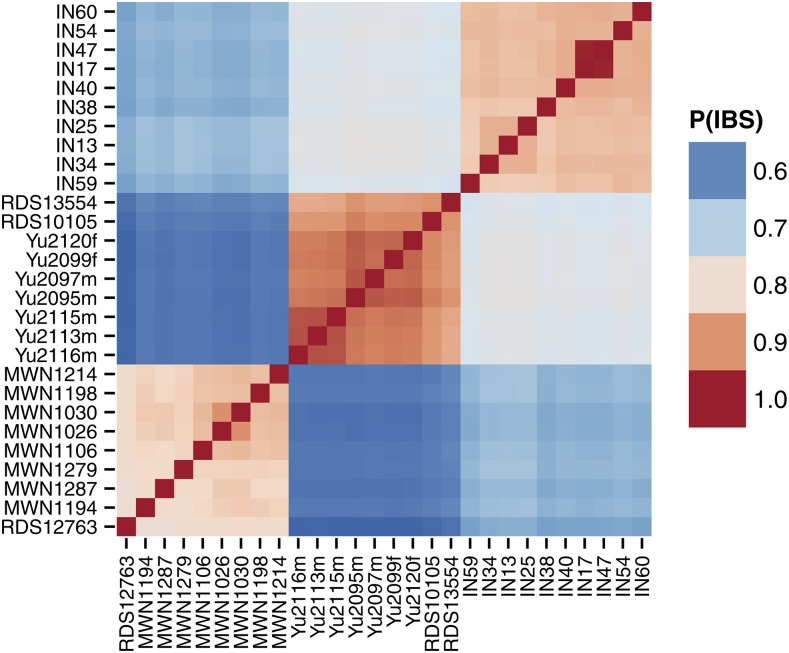
Figure 6.
Heatmap representation of matrix of pairwise genetic distances between 28 wild-caught mice from three different subspecies using data from the Mouse Diversity Array (Yang et al. 2011). Genetic distance is defined here as the proportion of alleles shared identical by state between two individuals. The matrix is hierarchically clustered to that more closely-related samples are adjacent to each other. The heatmap is useful for visualizing population structure; here it reveals obvious genetic differentiation between mouse subspecies.

