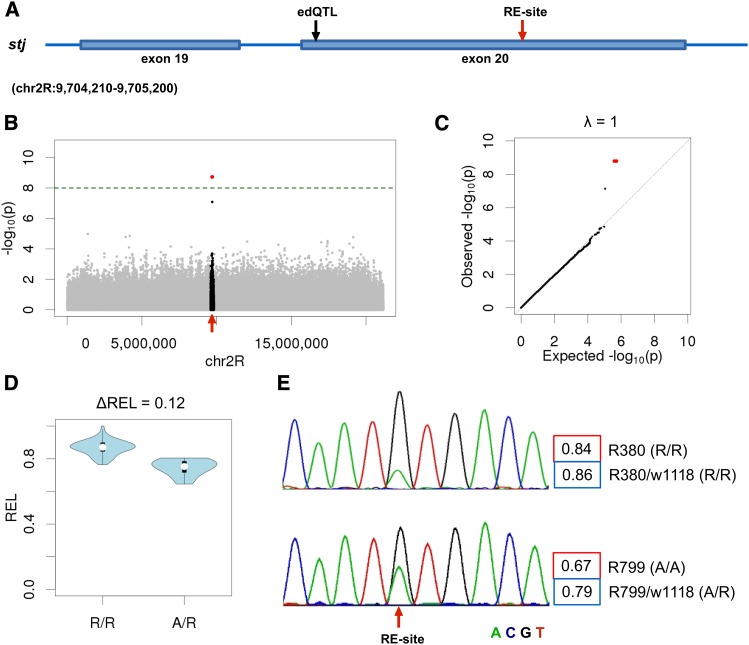
Figure 1.
RNA editing quantitative trait nucleotides (edQTN) in gene stj. (A) The position of edQTN and associated RNA editing site on stj gene. (B) Manhattan plot of association P-values for all SNPs from the same chromosome arm. The SNPs in 200-kb region around editing site are highlighted in black. The dashed green horizontal line indicates the Bonferroni corrected significance threshold corresponding to the primary association tests (P < 0.05). Significantly associated SNPs are highlighted in red. The position of the RNA editing site is marked by a red arrow. (C) Quantile–quantile plot for observed and expected distributions of association P-values (for the whole chromosome). The genome-wide inflation factor (λ) is indicated. (D) Distributions of RNA editing levels in F1-hybrids carrying reference (R/R) and alternative alleles (A/R) of edQTN (all F1-hybrids carried one copy of a reference allele from common tester line (w1118)). (E) Sanger sequencing chromatograms of RNA editing site for two inbred strains that carried only reference (R380 – R/R) or alternative alleles (R799 – A/A) of edQTN. RNA editing levels estimates based on Sanger sequencing and RNA-Seq data are shown in red and blue boxes, respectively (see Materials and Methods). Corresponding genotypes of edQTN in sequenced inbred lines and F1-hybrids are also indicated. Similar plots for all identified editing site/edQTN associations are provided in Figure S2, Figure S3, Figure S4, Figure S5, Figure S6, Figure S7, Figure S8, Figure S9, Figure S10, Figure S11, Figure S12, Figure S13, Figure S14, Figure S15, and Figure S16.

