Figure 5.
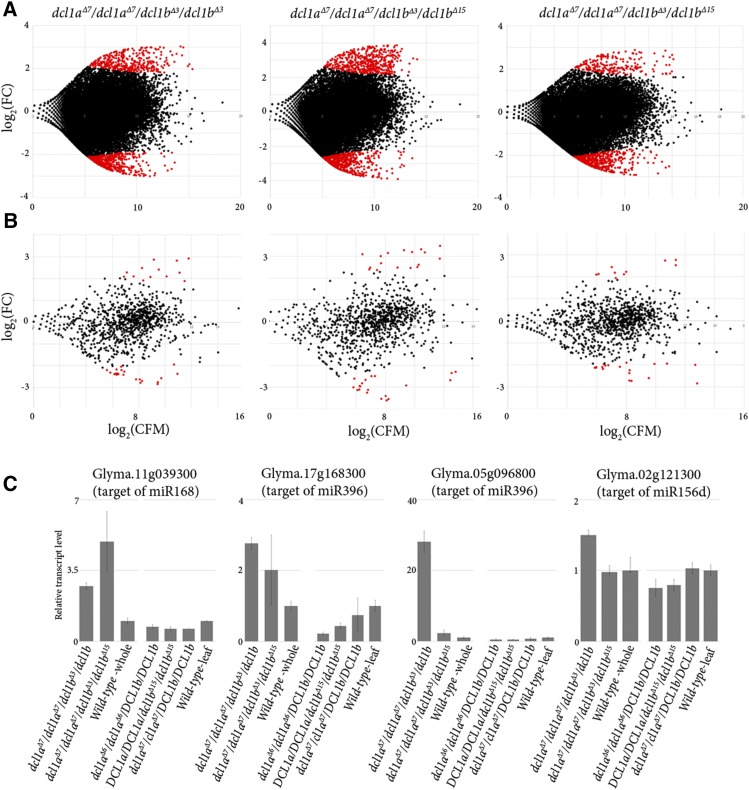
The analysis of predicted miRNA targets in the double dcl1 mutant. (A) Three MA plots of the dcl1 double mutants with one replicate of mutant dcl1aΔ7/dcl1aΔ7/dcl1bΔ3/dcl1bΔ3 and two replicates of mutant dcl1aΔ7/dcl1aΔ7/dcl1bΔ3/dcl1bΔ15. The plots show the differentially expressed transcripts in the dcl double mutant compared to wild-type, with the red dots indicating significantly perturbed transcript expression (P <0.05). (B) Three MA plots indicating differential expression for a subset of transcripts in (A). This subset includes only genes validated as miRNA target transcripts. A total of 985, 977 and 981 distinct miRNA targets were found to be expressed in each of the three assessed mutants, respectively. The red dots indicate the 35, 38 and 30 differentially expressed miRNA target transcripts (P <0.05) in each mutant when compared to wild-type controls. (C) RT-qPCR was used to determine the expression of a subset of miRNA target transcripts in single and double dcl1 mutant backgrounds. CPM, counts per million; FC, fold change.

