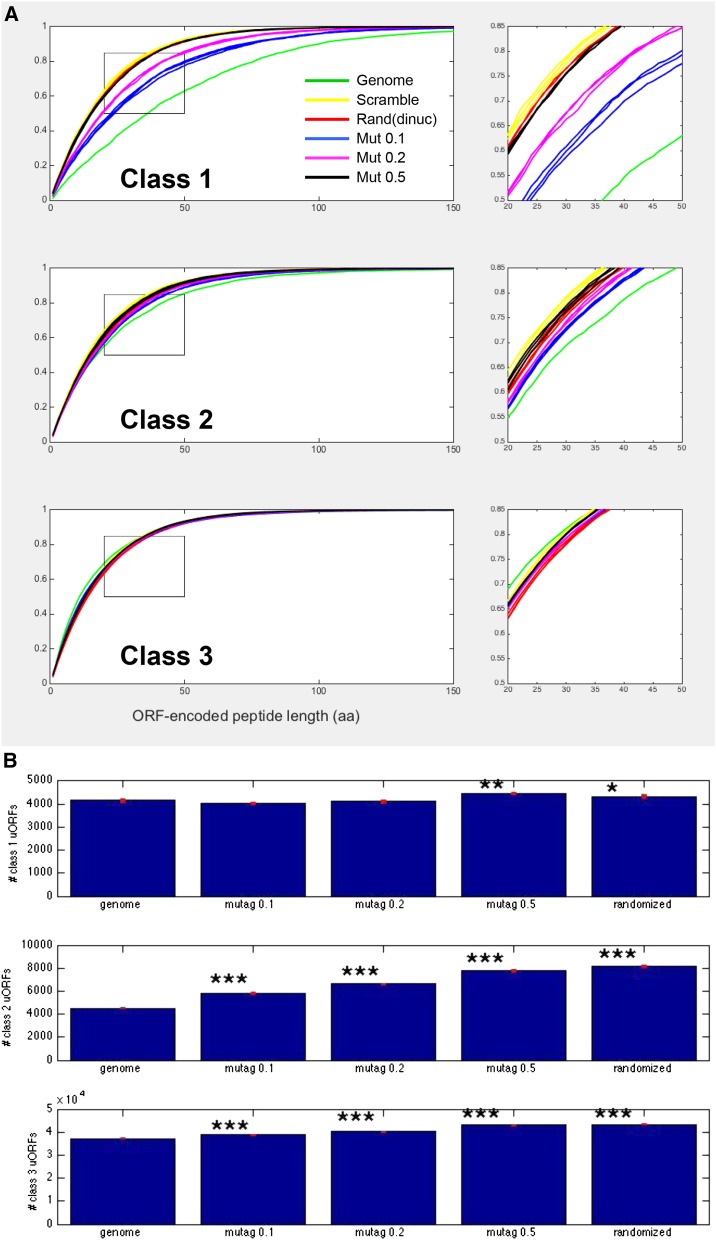
Figure 2.
Statistics of uORF length and number in the genome, and in partially or fully randomized controls. (A) Class 1 but not Class 2 or Class 3 uORFs are longer than the random expectation. Cumulative length distribution of three classes of uORFs for the genome (green) and for randomized or mutagenized controls (three replicates of each). ‘Scramble’: each 5UT sequence was randomized (yellow); ‘Rand(dinuc)’: sequences of the same length as the real 5-UT sequences were constructed with identical dinucleotide frequencies to the overall ‘5UT-ome’ (red); Mut 0.1/0.2/0.5: the set of 5UT sequences was ‘mutagenized’ by replacing one in 10, one in five, or one in two nucleotides in each 5UT with random selections from the overall nucleotide frequency distribution of the complete collection of 5UT sequences. (Note: the randomized distribution for all classes is essentially identical to the class 3 length distribution for the actual genomic Class 3 sequences.) The indicated box in each graph is blown up at right to show high reproducibility of randomized results for the three replicates. (B) Total numbers of uORFs with and without randomization. The small red bar represents a hypothetical standard deviation based on the assumption that numbers in each category are Poisson-distributed (square root of the number observed). Stars represent P-values for a t-test comparing each randomization to the genome, using these standard deviations: * P < 0.05; ** P < 0.01; *** P < 0.001). Randomizing by scrambling (shown) or by dinucleotide frequencies gave very similar results.

