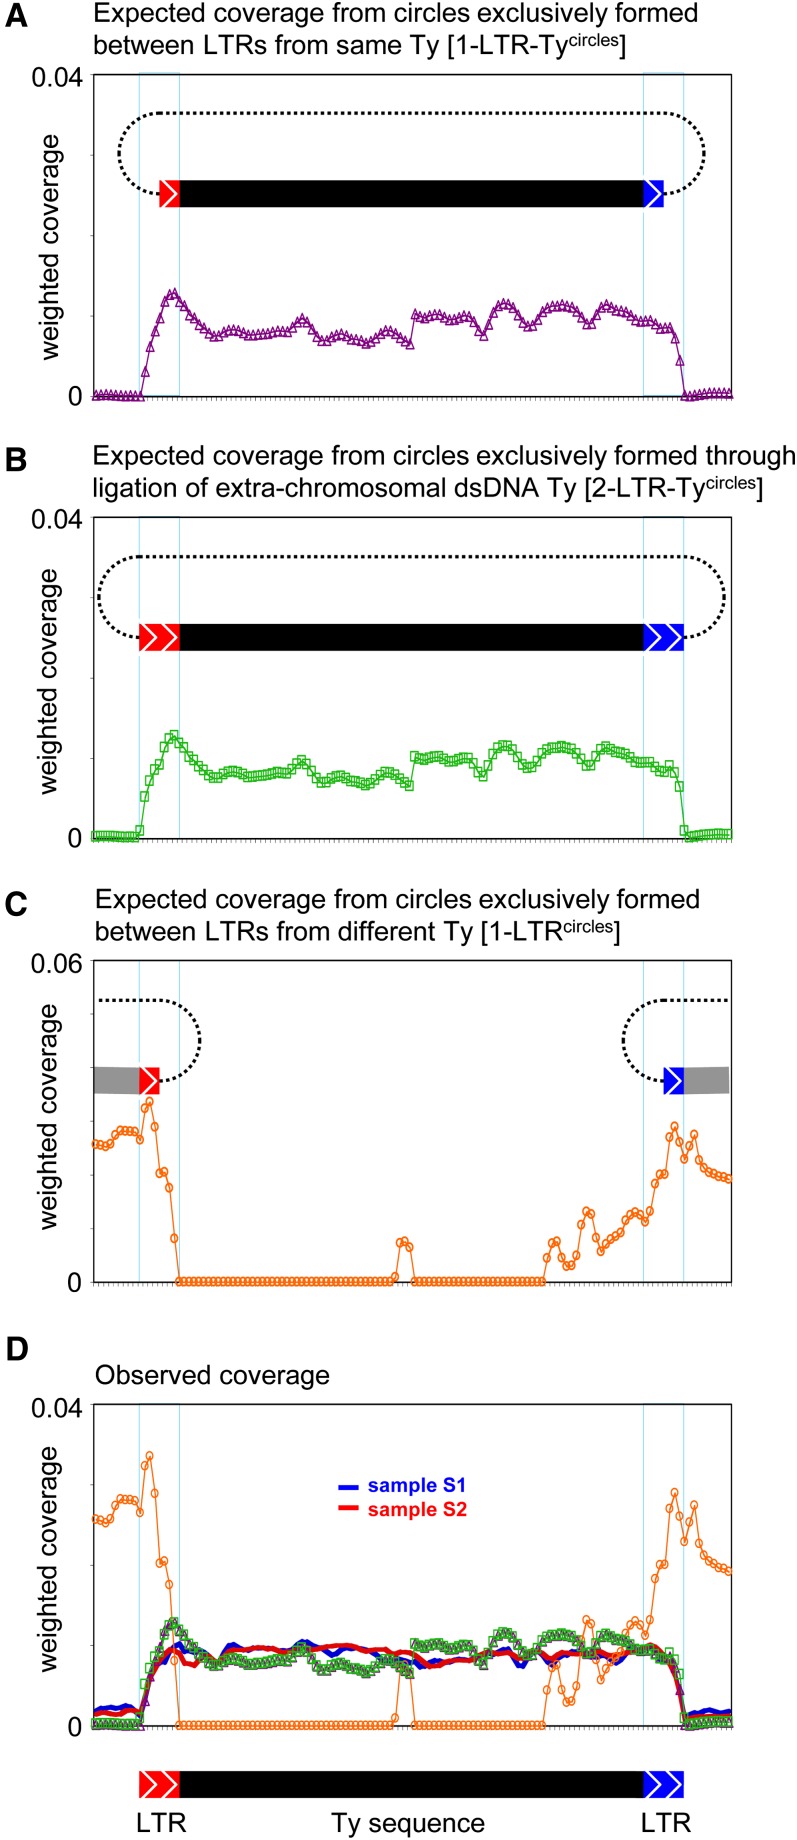
Figure 5.
Expected and observed read coverage across full-length Ty elements. For each annotated full-length Ty element, weighted coverage was recorded in ten 50-bp windows up- and downstream of the element, and in 50-bp windows inside the entire Ty element. The represented plots represent the average of 32 annotated full-length Ty elements. (A) In silico genomic mapping of expected coverage of full-length Ty elements based on reads extracted from all putative [1-LTR-Tycircles]. (B) In silico genomic mapping as in (A), but using reads extracted from all putative [2-LTR-Tycircles]. (C) Expected weighted read coverage of [1-LTR-Tycircles] formed between LTRs of different Ty elements, based on in silico genomic mapping of reads extracted from putative eccDNAs with an LTR. (D) Combined plot of A–C together with the observed weighted read coverage of Ty1 elements in samples S1 and S2, respectively. In plots A–C, a schematic representation of the simulated circles is shown. The extent of the Ty internal and LTR sequences on the x-axes is shown below plot D, and the borders of the LTR sequences are indicated on each plot by thin blue vertical lines.

