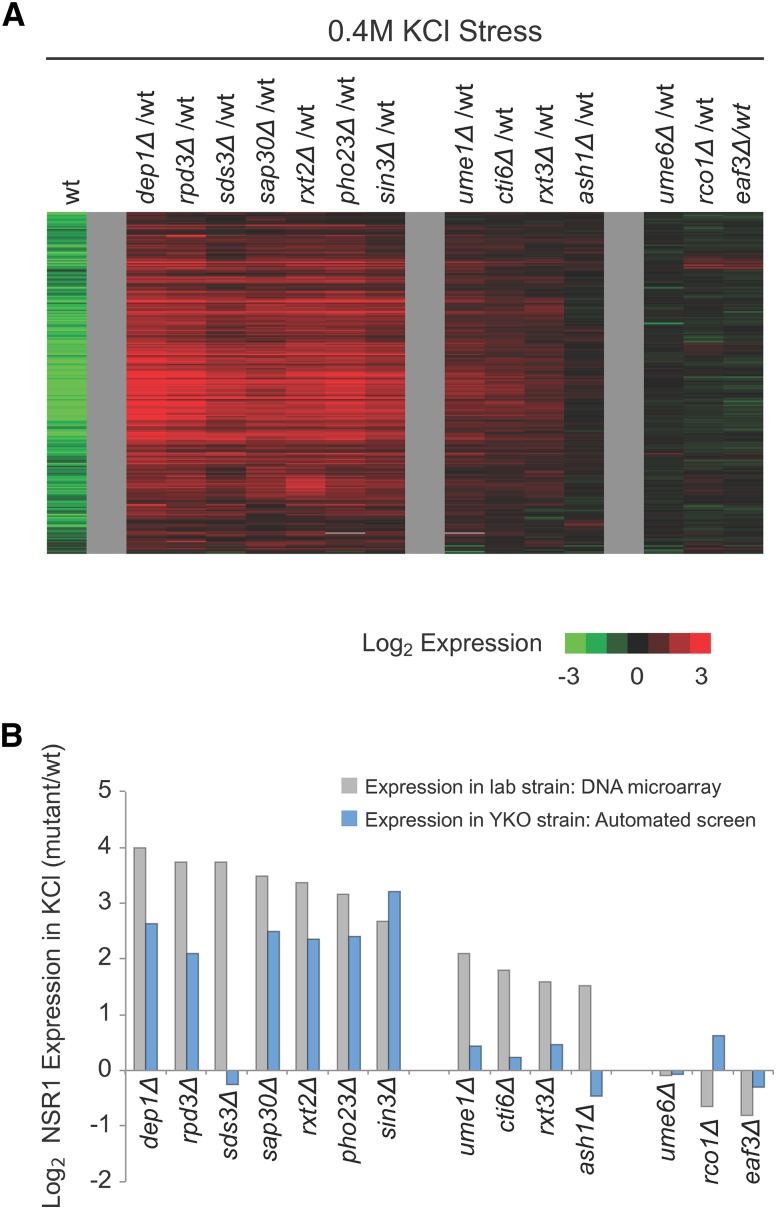
Figure 4.
Rpd3L dependent gene expression in osmotic stress conditions. (A) DNA microarrays were use to measure the expression of Ribi genes after 20 min of 0.4 M KCl stress in the wild type strain (Column 1), and mutants missing all 14 subunits in the Rpd3L and Rpd3S complexes (Columns 2–15). In the experiment with the wild-type strain, we compared the cDNA from cells treated with stress (labeled with Cy5; red) to the cDNA from cells harvested prior to stress (labeled with Cy3; green). In experiments with the mutant strains, we compared cDNA from the mutant treated with stress (labeled with Cy5; red) to cDNA from the wild-type strain treated with stress (labeled with Cy3; green). Thus, the green bars in the first column show Ribi genes that are repressed in osmotic stress, while the red bars in each subsequent column show the genes that are hyper expressed in stress. (B) Graph showing the change in NSR1 expression caused by deletion of each subunit in Rpd3L/S as measured by DNA microarray analysis of strains made in the W303 background (gray bars) and the automated analysis of the YKO collection (blue bars).

