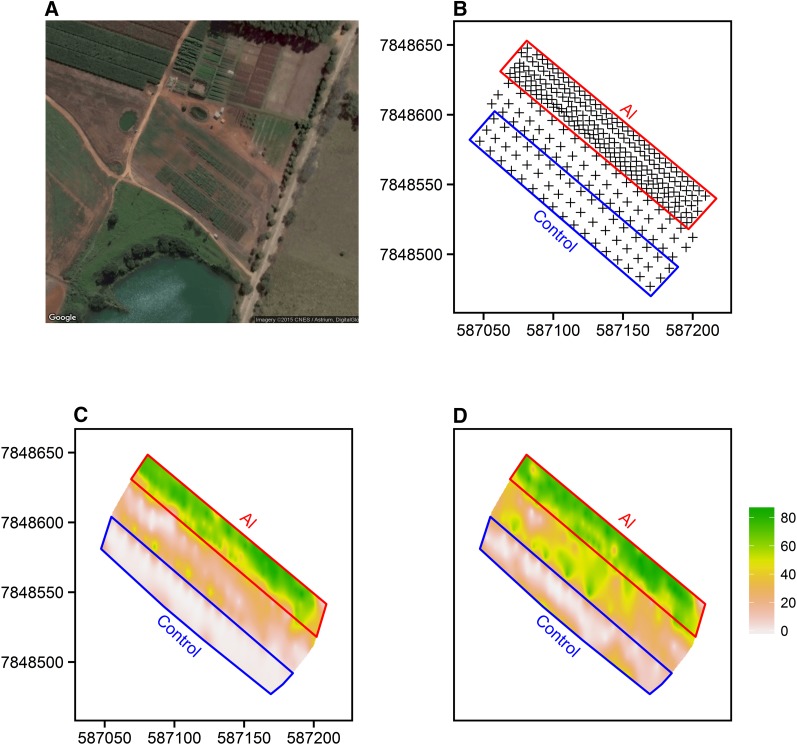
Figure 1.
Field phenotyping sites. Satellite image (A) and respective soil sampling points (B). Al saturation (%) spatial variation in the superficial (0–20 cm) (C), and subsuperficial (20–40 cm) (D) soil layers. Adapted from Menezes et al. (2014). x- and y-axis in panels B, C and D correspond to spatial coordinates in Universal Transverse Mercator (UTM) 23k format. Satellite images were obtained on March 5, 2014.

