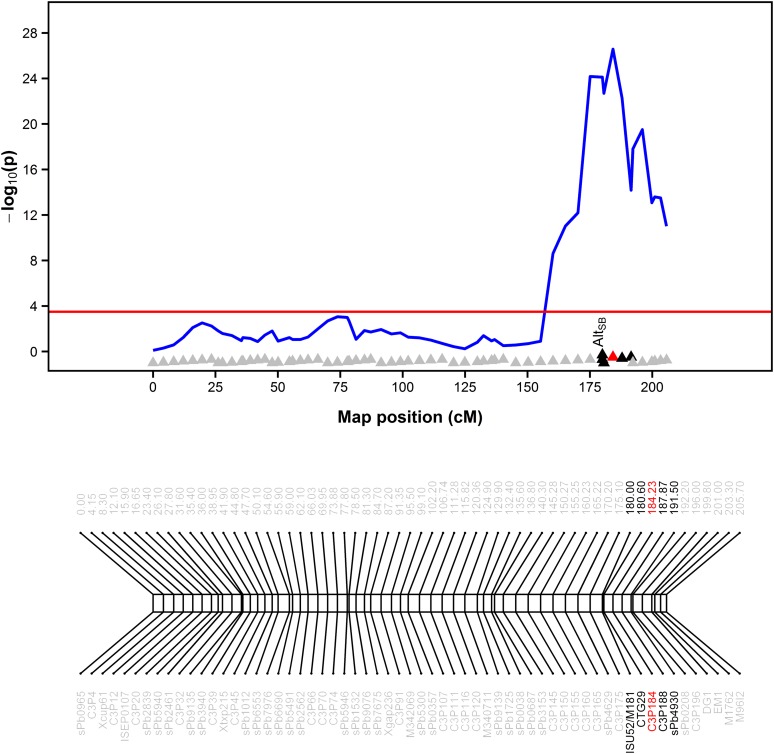
Figure 4.
Detailed graphical display of the QTL detected by a multi-trait QTL analysis on chromosome 3 for relative net root growth (RNRG) after 5 d at {27} µM Al3+ in nutrient solution and grain yield (ton ha–1) under 56% Al saturation stress in the field. The associated tail probability of the Wald statistics, P, is expressed as –log10(p), analogous to the usual LOD score profile. The red horizontal line indicates the significant threshold obtained using the Li and Ji (2005) correction with α = 5%.

