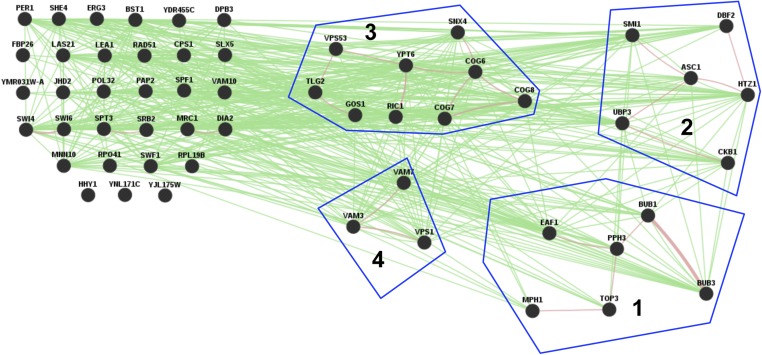
Figure 4.
Genetic and physical interactions between the highest scoring 55 genes. Green and pink edges indicate genetic and physical interactions, respectively. Groups 1, 2, 3, and 4 indicate physical interaction networks within a subset of the proteins encoded by their respective genes. Genetic and physical interactions were determined using GeneMANIA to analyze the top 55 scoring genes.

