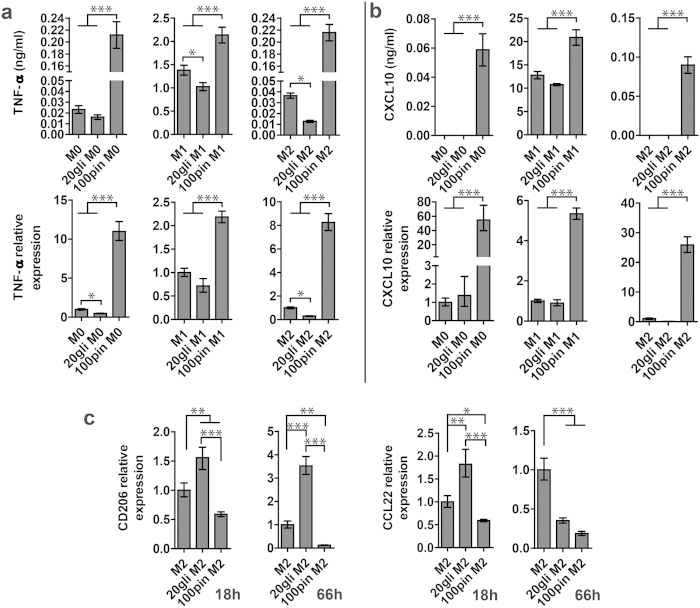
Figure 4. Effects of glibenclamide and pinacicil prepolarization treatment on macrophage polarization.
(a) TNF-α and (b) CXCL10 secretion (upper row) and gene expression (lower row) in M0, M1 and M2 macrophages at 66 h. (c) CD206 and CCL22 gene expression in M2 macrophages at 18 and 66 h. PCR data are normalized to GAPDH and relative to gene expression level of untreated controls. The data are shown as mean ± S. D (n = 3–4) and representative of two independent experiments. Statistical significances are reported among samples at the same time point using one way Anova (***p < 0.001, **p < 0.01 and *p < 0.05).

