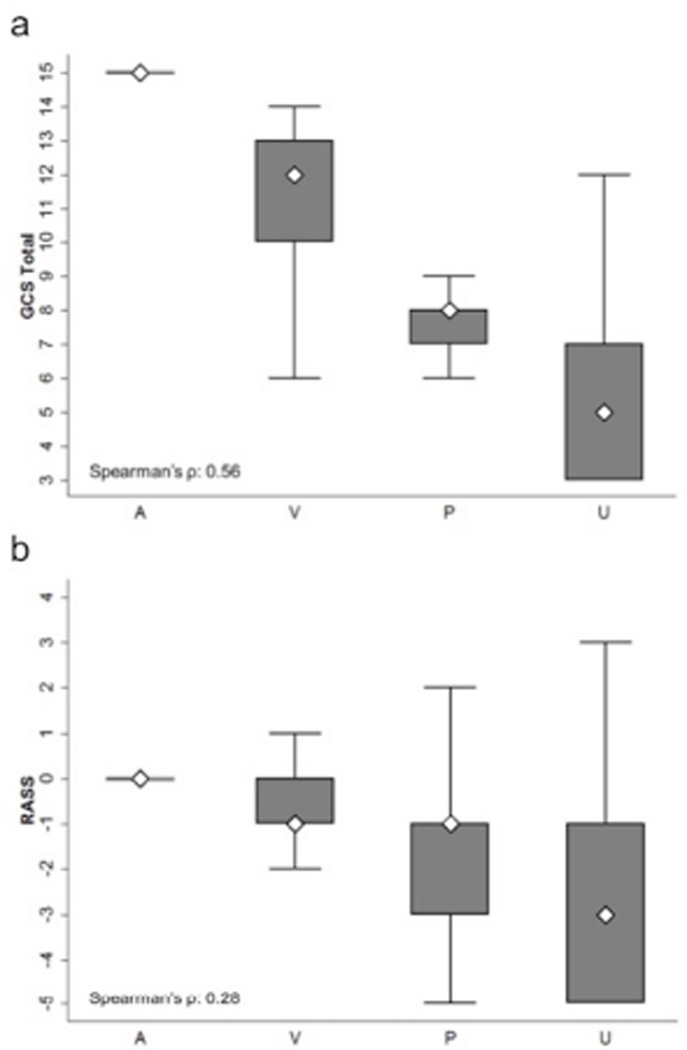
Figure 1.
Score correlations between (1a) AVPU and GCS Total, and between (1b) AVPU and RASS*
*Boxes indicate interquartile range (25th to 75th percentiles), whiskers indicate 5th to 95th percentiles and diamonds indicate median. Each correlation significant at P<0.001. Abbreviations: AVPU, Alert-Voice-Pain-Unresponsive; GCS, Glascow Coma Scale; RASS, Richmond Agitation Sedation Scale.

