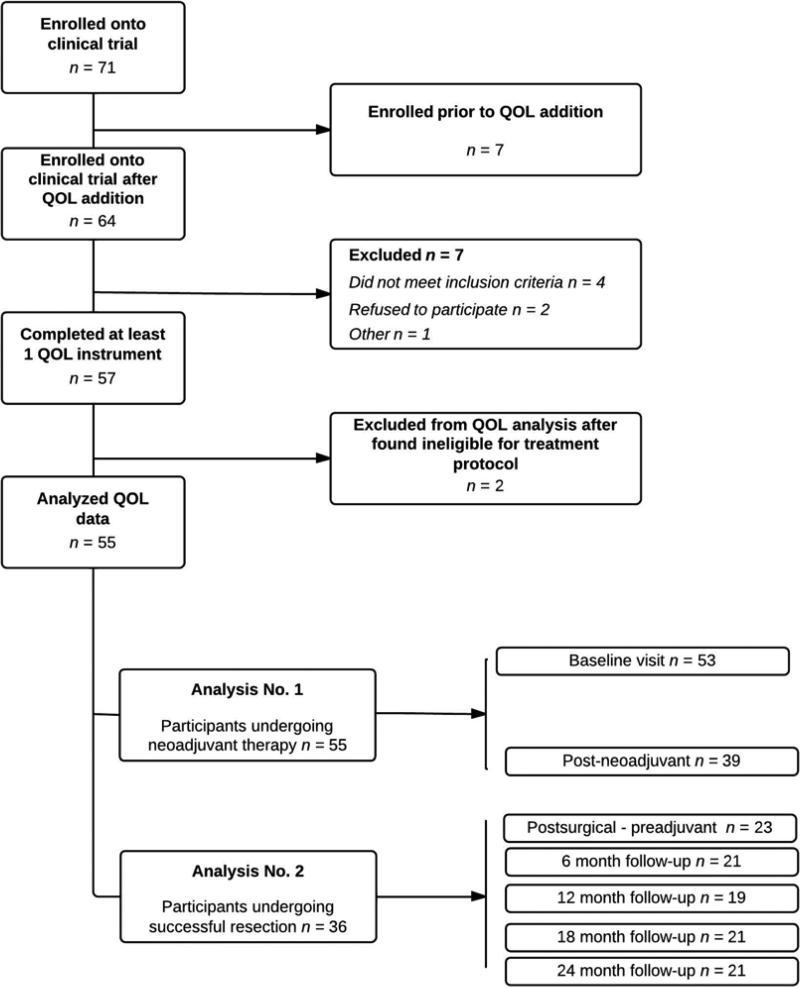
Figure 1.
Diagram of participants and sample evolution: This is a flow chart of the evaluable patients grouped by analysis (No. 1 and 2) indicating the number of patients with analyzable QOL instruments at each subsequent step and time-point. “Other” refers to one patient removed from study due to non-compliance with treatment protocol.

