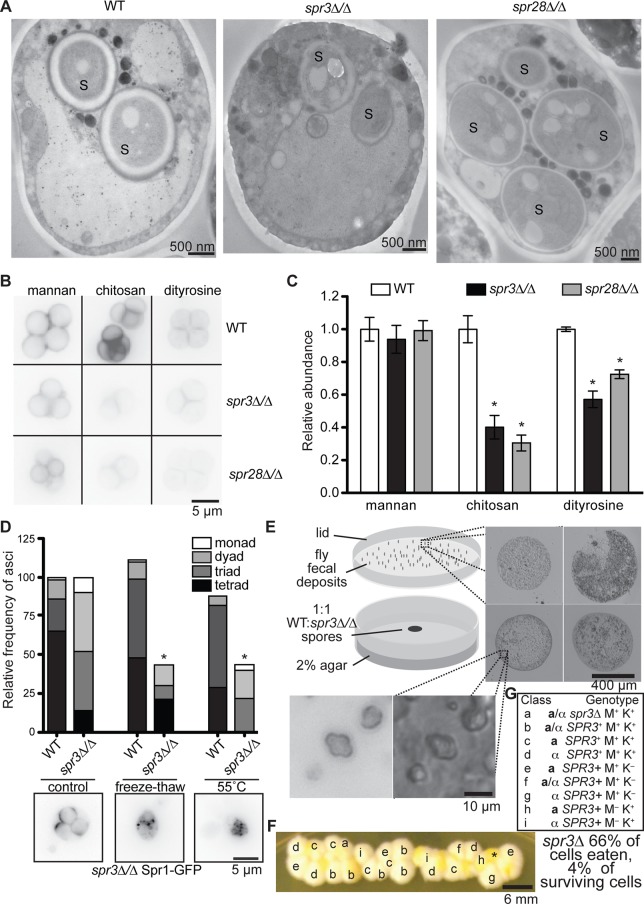
FIGURE 2:
Spore wall defects in septin-mutant cells. (A) EM micrographs as in Figure 1F. (B) Representative images of spores of the indicated genotypes stained with fluorescein–Con A (mannan), eosin Y (chitosan), or autofluorescence in unstained cells visualized with a DAPI filter (dityrosine; Briza et al., 1986). (C) Quantification via line scans of fluorescence signals as in B for at least 9, 14, or 34 cells/genotype. Error bars, SEM. *p < 0.0001 for unpaired t test compared with WT. (D) Asci of the indicated genotypes were analyzed as in Figure 1A (control) and then exposed to either a freeze–thaw cycle or 55°C for 2 h and analyzed again. Values were normalized to pretreatment values for each genotype. Bottom, representative images of Spr1-GFP fluorescence in spr3∆/∆ cells after the indicated treatments. (E) WT and spr3∆/∆ sporulation cultures were mixed to create an equal proportion of total spores of each genotype and fed to starved adult WT Drosophila for 18 h in a Petri dish. Top right, four representative fecal deposits on the lid visualized directly with a 10× objective. Bottom left, transmitted light and fluorescence image taken with a GFP filter cube and 40× objective. (F) Colonies on rich medium produced by resuspended fecal deposits (E). Asterisk, nonyeast colony. Other labels correspond to genotypes shown in G; see Supplemental Figure S2 for details. K, lysine; M, methionine.

