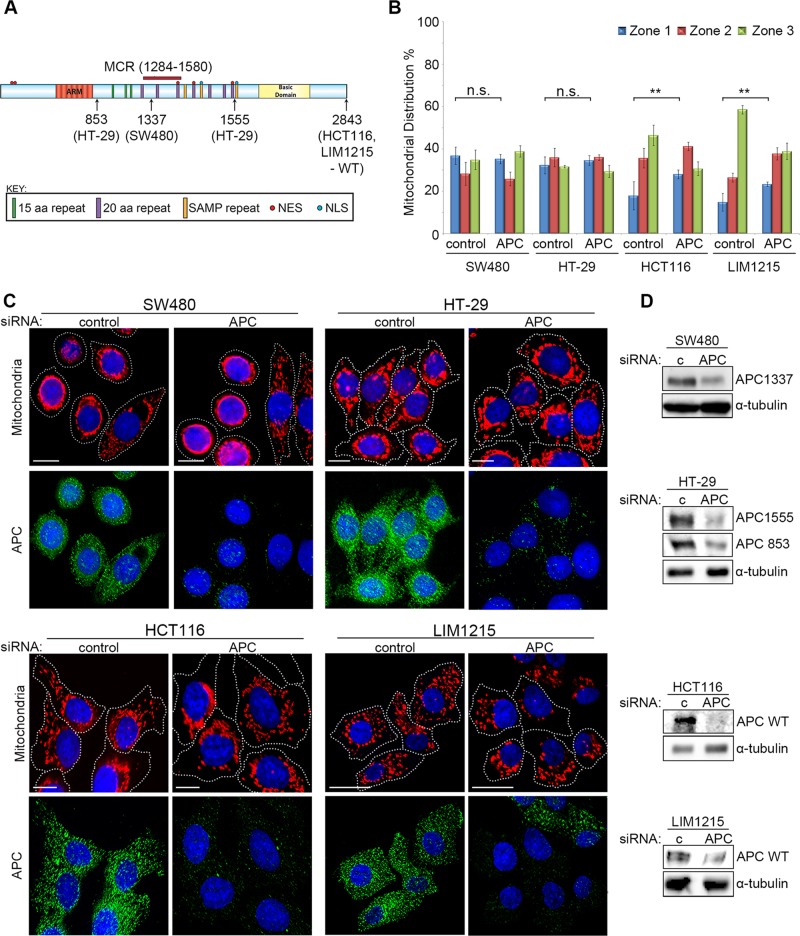
FIGURE 2:
Truncated mutant APC fails to regulate mitochondrial redistribution. (A) APC mutation status of CRC cell lines examined is indicated by schematic. (B and C) Cells treated with control or APC pooled siRNA (APC #1 and #2) were analyzed by immunofluorescence microscopy for mitochondrial distribution. (B) Mitochondrial localization patterns were scored and compared as previously described (Figure 1 legend). Graph indicates where loss of APC caused significant differences to perinuclear distribution relative to control (**, p < 0.01; n.s., not significant). Bar graph data presented as mean (±SD), statistical analysis by unpaired two-tailed t test. (C) Typical cell images after staining for mitochondria (CMX-Ros) and APC are shown. (D) Western blot confirms knockdown of full-length and mutant forms of APC in different CRC cell lines. α-Tubulin is the loading control. Scale bars: 10 μm.

