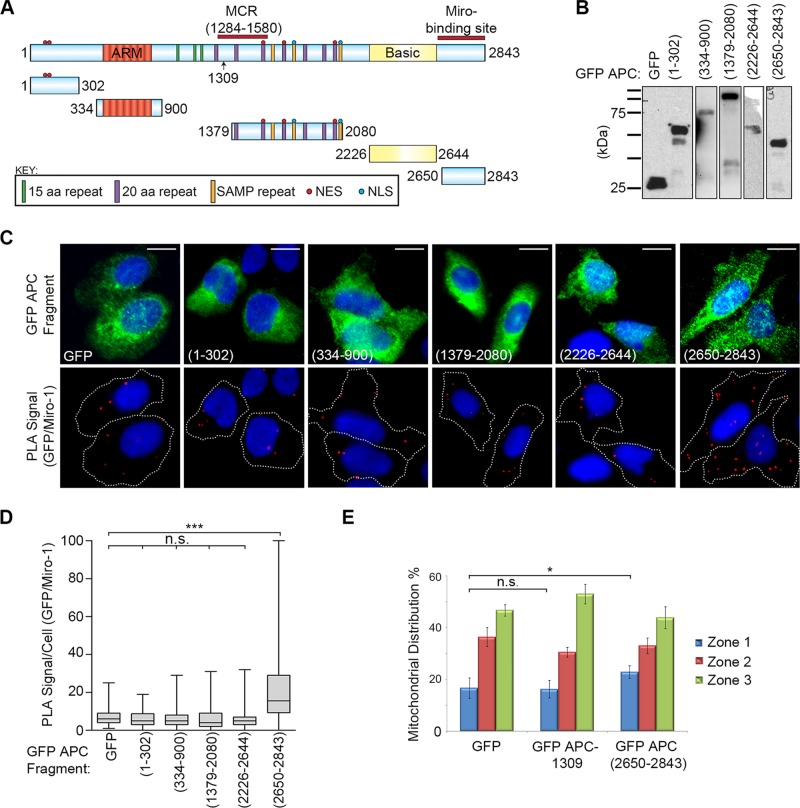
FIGURE 8:
Miro-1 interacts with the C-terminal fragment (2650–2843) of APC. (A) Schematic of GFP-tagged APC fragments overexpressed in U2OS cells and used to map the Miro-binding domain. (B) Western blot to confirm expression and integrity of the GFP-APC fragments. (C) GFP-APC fragments and Miro-1 were analyzed for their ability to form protein complexes in situ using Duolink PLA. Representative cell images are shown, with PLA GFP-Miro complexes indicated by red dots. Scale bars: 10 μm. (D) The PLA signals per cell were scored to reveal that only one GFP-APC fragment (2650–2843) associated with Miro (***, p < 0.001) above the GFP background, indicative of a positive interaction. n > 97 cells for each sample over two independent experiments. Box-and-whisker plot presents a median (line), upper/lower quartile (box), and min/max (error bars with 95% CI). Statistical analysis for samples above background by Mann-Whitney U-test with Bonferroni correction. (E) U2OS cells expressing GFP or GFP-APC fragments were scored for mitochondrial distribution. Overexpression of the APC(2650–2843) fragment caused a statistically significant increase in perinuclear mitochondrial distribution relative to GFP control. Bar graph data presented as mean (±SD), statistical analysis by unpaired two tailed t test (*, p < 0.05; n.s., not significant).

