
FIGURE 4:
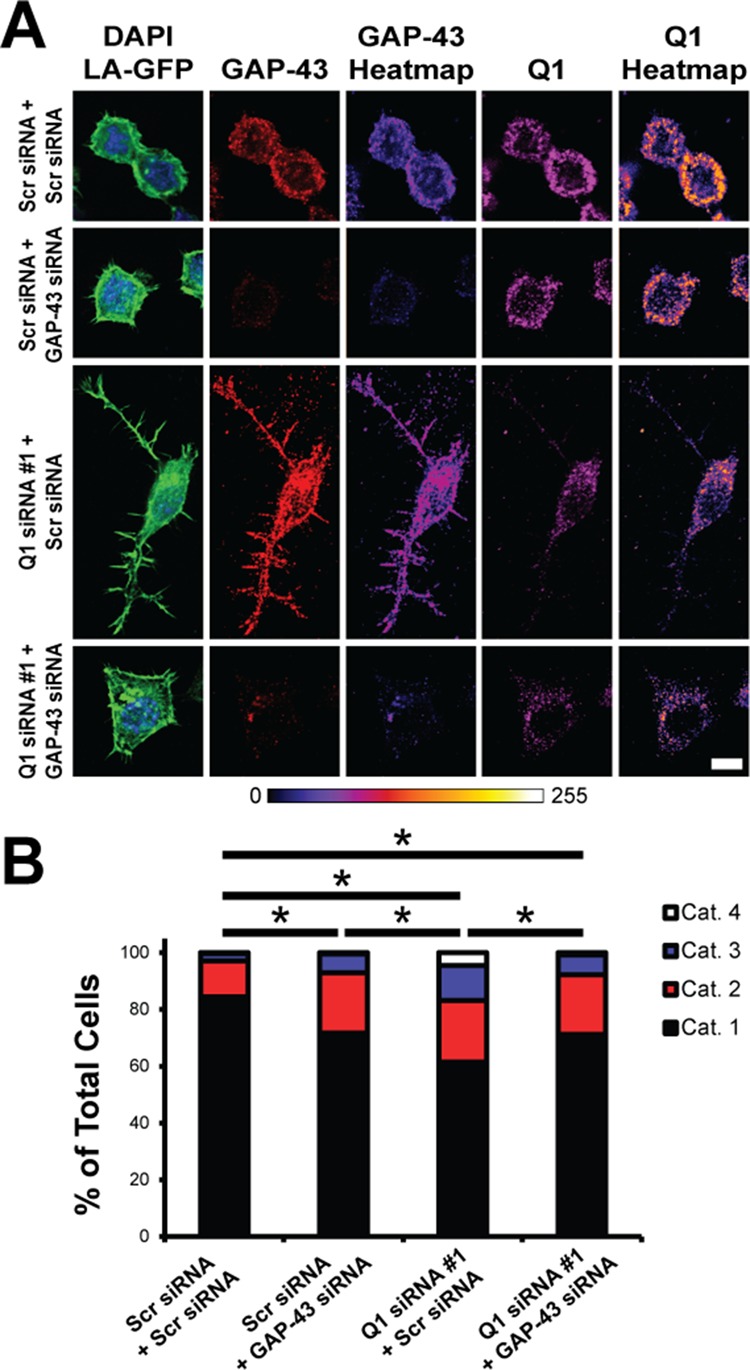
Increased N2a cell process extension due to increased GAP-43 protein expression upon hnRNP-Q1 knockdown. N2a cells were transfected with hnRNP-Q1 #1 or Scr siRNA, GAP-43 or Scr siRNA and Lifeact-GFP and processed for immunofluorescence with GAP-43 and hnRNP-Q1 antibodies after 72 h. Cells were then imaged and categorized based on their degree of process extension (see Supplemental Figure 3A). (A) Representative images with heat maps. Scale bar: 10 μm. (B) Quantification of the results. Percent of cells in each category: Scr + Scr: cat. 1 = 84.4%; cat. 2 = 12.7%; cat. 3 = 2.6%; cat. 4 = 0.3%; Scr + GAP-43: cat. 1 = 71.6%; cat. 2 = 21.3%; cat. 3 = 6.7%; cat. 4 = 0.4%; Q1 + Scr: cat. 1 = 61.5%; cat. 2 = 21.7%; cat. 3 = 12.3%; cat. 4 = 4.5%; Q1 + GAP-43: cat. 1 = 71.2%; cat. 2 = 21.1%; cat. 3 = 6.9%; cat. 4 = 0.8%. n = 4, Scr + Scr: 379 cells; Scr + GAP-43: 239 cells; Q1 + Scr: 286 cells; and Q1 + GAP-43: 261 cells from four independent experiments. Kruskal-Wallis test, Dunn’s posthoc, p values: Scr + Scr vs. Scr + GAP-43, p = 0.0029; Scr + Scr vs. Q1 + Scr, p < 0.0001; Scr + Scr vs. Q1 + GAP-43, p = 0.0013; Scr + GAP-43 vs. Q1 + Scr, p = 0.0137; Scr + GAP-43 vs. Q1 + GAP-43, p > 0.9999; Q1 + Scr vs. Q1 + GAP-43, p = 0.0156.