FIGURE 8:

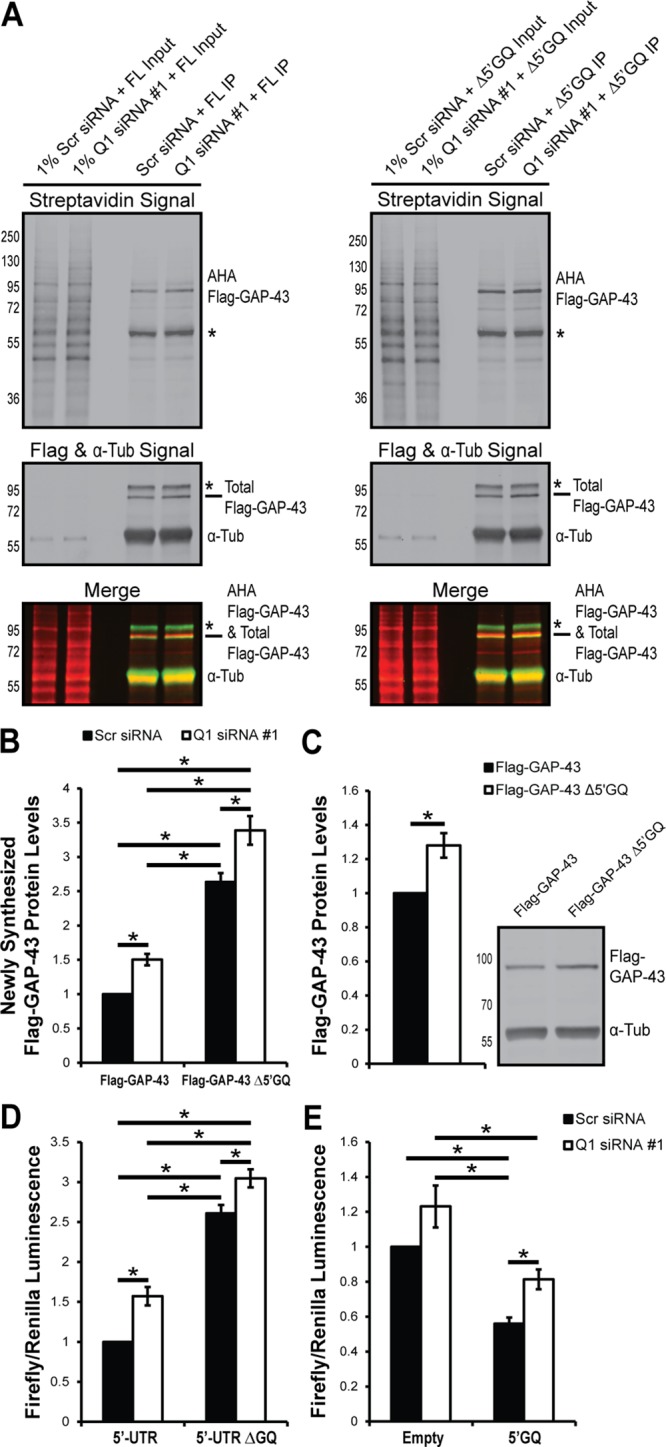
hnRNP-Q1 represses Gap-43 mRNA translation through the Gap-43 5′-UTR GQ sequence. (A) N2a cells were transfected with 3×Flag-mCherry-tagged GAP-43 reporters with (FL) and without (Δ5′GQ) the 5′GQ ∼56 h after hnRNP-Q1 #1 or Scr siRNA transfection. After ∼16 h, the cells were starved of methionine for 1 h and labeled with the methionine analogue AHA for 2 h. AHA incorporated into newly synthesized proteins was labeled with biotin; 3×Flag-mCherry-tagged GAP-43 was immunoprecipitated; and newly synthesized 3×Flag-mCherry-tagged GAP-43 (predicted to be ∼75 kDa) was visualized by immunoblot with streptavidin and anti-Flag. Top, the streptavidin signal; bottom, total Flag, α-tubulin signal and AHA Flag-GAP-43/Total Flag-GAP-43 merged signals. *, Nonspecific bands. (B) Quantification of AHA Flag-GAP-43 protein levels normalized to total α-tubulin protein levels from 1 or 5% input. n = 6, two-way ANOVA, Holm Sidak’s posthoc, p values: Scr + FL vs. Scr + ΔGQ, p < 0.0001; Scr + FL vs. Q1 + FL, p = 0.0127; Scr + FL vs. Q1 + ΔGQ, p < 0.0001; Scr + ΔGQ vs. Q1 + FL, p < 0.0001; Scr + ΔGQ vs. Q1 + ΔGQ, p = 0.0011; Q1 + FL vs. Q1 + ΔGQ, p < 0.0001. (C) The 3×Flag-mCherry–tagged GAP-43 reporter constructs were overexpressed in N2a cells for ∼16 h, and reporter expression was visualized by Flag immunoblot. n = 5, one-sample t test, p value = 0.0177. (D) N2a cells were transfected with hnRNP-Q1 #1 or Scr siRNA, the 5′ or 5′ΔGQ firefly luciferase construct, and a Renilla luciferase construct for normalization. After 72 h, the cells were trypsinized and processed for luciferase activity. n = 5, two-way ANOVA, Tukey’s posthoc, p values: Scr + 5′ vs. Scr + ΔGQ, p < 0.0001; Scr + 5′ vs. Q1 + 5′, p = 0.0035; Scr + 5′ vs. Q1 + ΔGQ, p < 0.0001; Scr + ΔGQ vs. Q1 + 5′, p < 0.0001; Scr + ΔGQ vs. Q1 + ΔGQ, p = 0.0248; Q1 + 5′ vs. Q1 + ΔGQ, p < 0.0001. (E) N2a cells were transfected with hnRNP-Q1 #1 or Scr siRNA, the 5′GQ or empty vector firefly luciferase construct, and a Renilla luciferase construct for normalization. After 72 h, the cells were trypsinized and processed for luciferase activity. n = 6, two-way ANOVA, Holm Sidak’s posthoc, p values: Scr + E vs. Scr + 5′GQ, p = 0.0010; Scr + E vs. Q1 + E, p = 0.0543; Scr + E vs. Q1 + 5′GQ, p = 0.0694; Scr + 5′GQ vs. Q1 + E, p < 0.0001; Scr + 5′GQ vs. Q1 + 5′GQ, p = 0.0492; Q1 + E vs. Q1 + 5′GQ, p = 0.0014.
