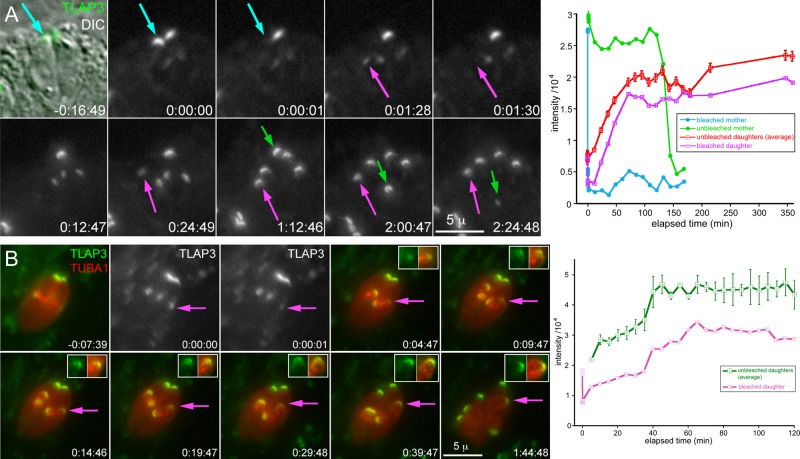
FIGURE 6:
FRAP of mNeonGreenFP-TLAP3 knock-in parasites. (A) Selected images showing a vacuole containing two mNeonGreenFP-TLAP3 knock-in parasites in which nascent daughter parasites had formed before the photobleaching (also see Supplemental Video S3). The mNeonGreenFP-TLAP3 cap was bleached in one of the mothers (cyan arrow, 0:00:01) and one of its nascent daughter parasites (magenta arrow, 0:01:30). The green arrow indicates the unbleached mother transported to the base of the vacuole and degraded as the daughters completed budding. The graph on the right shows the intensity measurements of mNeonGreenFP-TLAP3 in the cap region of the bleached mother (cyan), unbleached mother (green), and bleached daughter (magenta) and the average for unbleached daughters (red). X-axis, elapsed time (minutes). Y-axis, measured intensity/104. Error bars are ±SEM. (B) Selected images showing a vacuole containing two mNeonGreenFP-TLAP3 knock-in parasites expressing mCherryFP-Tgα1-tubulin (TUBA1). Nascent daughter parasites had formed before the photobleaching. The mNeonGreenFP-TLAP3 cap was partially bleached in one of the nascent daughter parasites (magenta arrow, 0:00:01). Insets: 1.25×. The graph on the right shows the intensity measurements of mNeonGreenFP-TLAP3 in the cap region of the bleached daughter (magenta) and the average for unbleached daughters (green). X-axis: elapsed time (minutes). Y-axis: measured intensity/104. Error bars are ±SEM.

