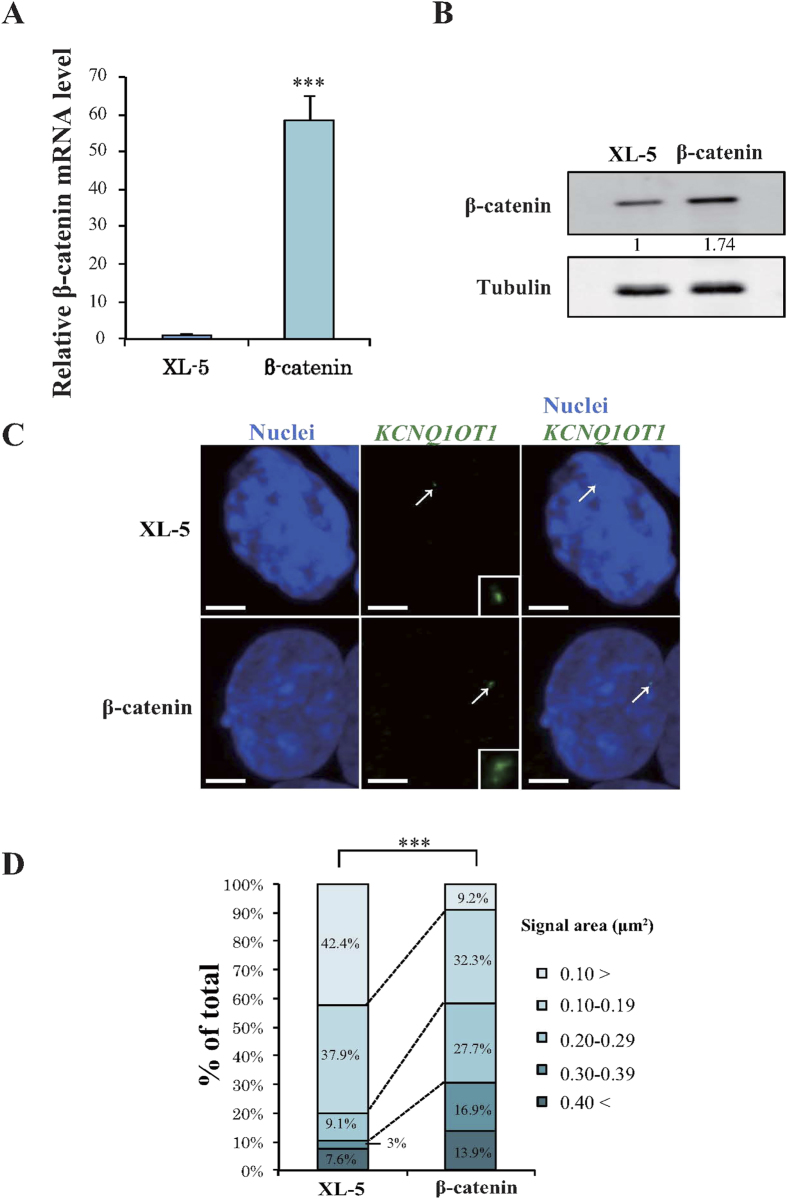
Figure 2. Overexpression of β-catenin enhances transcription and lncRNA-coated territory of KCNQ1OT1 in HCT116 cells.
HCT116 cells were transfected with a β-catenin expression vector or with the control XL-5 vector, and the cells were analyzed 24 h after transfection as follows. (A) qRT-PCR analysis of relative β-catenin mRNA expression levels. Expression levels were normalized to GAPDH mRNA control. The expression level in HCT116 cells transfected with the XL-5 vector was arbitrarily assigned as 1. Error bars represent means ± S.D. of three independent experiments (***p < 0.001). (B) Western blotting analysis of β-catenin protein levels. Band intensities were densitometrically assayed and analyzed using FUJIFILM Multi Gauge software. The protein levels of β-catenin were normalized to the levels of tubulin. The protein level in HCT116 cells transfected with the XL-5 vector was arbitrarily assigned as 1. Cropped blot images were used in this figure. Full-length blots are presented in Supplementary Fig. S3. (C) Representative RNA-FISH analysis of KCNQ1OT1 lncRNA-coated territory (green; arrows) and the insets show enlarged images of KCNQ1OT1 lncRNA. Nuclei (blue) were stained with DAPI. Scale bars represent 3 μm. (D) Quantification of KCNQ1OT1 lncRNA-coated territory in RNA-FISH analysis. The 100% stacked bar charts indicate the percentage of nuclei displaying the indicated signal area of KCNQ1OT1 lncRNA-coated territory (β-catenin, n = 65; XL-5, n = 66, ***p < 0.001)

