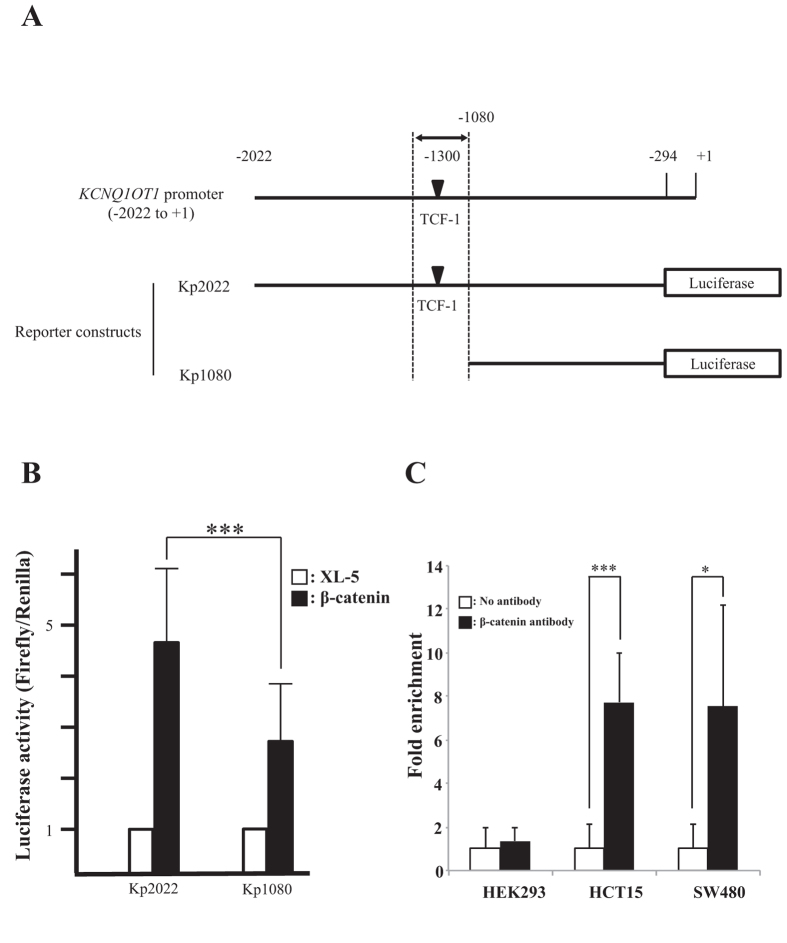
Figure 4. β-catenin directly regulated KCNQ1OT1 promoter activity in vivo in colorectal cancer cells via binding to a TCF-1 site in the KCNQ1OT1 promoter.
(A) Schematic representation of the KCNQ1OT1 promoter region and the reporter constructs used for the luciferase assay. The region of the KCNQ1OT1 promoter shown is from the transcription start site (TSS, + 1) to −2022. The predicted β-catenin binding site (TCF-1, black inverted triangle) is located −1300 up-stream from the TSS. Arrows indicate the PCR amplification region −1211 to −1351 for the ChIP assay. The two luciferase reporter vectors used in the luciferase assay are indicated. One reporter contains the KCNQ1OT1 promoter region from −294 to −2022 (Kp2022). The other reporter contains a truncated promoter in which the TCF-1 region was deleted (Kp1080). (B) These reporter or control vectors were co-transfected with into HCT116 cells. 24 h later, luciferase activity was measured. Renilla luciferase values were normalized to total protein concentration. Luciferase activity in HCT116 cells transfected with Kp2022 and the XL-5 vector or Kp1080 and the XL-5 were arbitrarily set at 1, respectively. Data are presented as the means ± S.D. of six independent experiments (***p < 0.001). (C) The ChIP assay of β-catenin binding to the TCF site in the KCNQ1OT1 promoter in the human embryonic kidney (HEK293) cell line and the colorectal cancer cell lines HCT15 and SW480. The assay was performed with or without β-catenin antibody. DNA was recovered from immunoprecipitated and nonimmunoprecipitated (input) chromatin and analyzed by qRT-PCR. The fold enrichment of target sequence in precipitated DNA compared with input DNA was calculated by comparison of the threshold cycle value of the sample of precipitated DNA with the standard curve generated from those of input DNA. Data are presented as the means ± S.D. of three independent experiments (***p < 0.001 and *p < 0.05).

