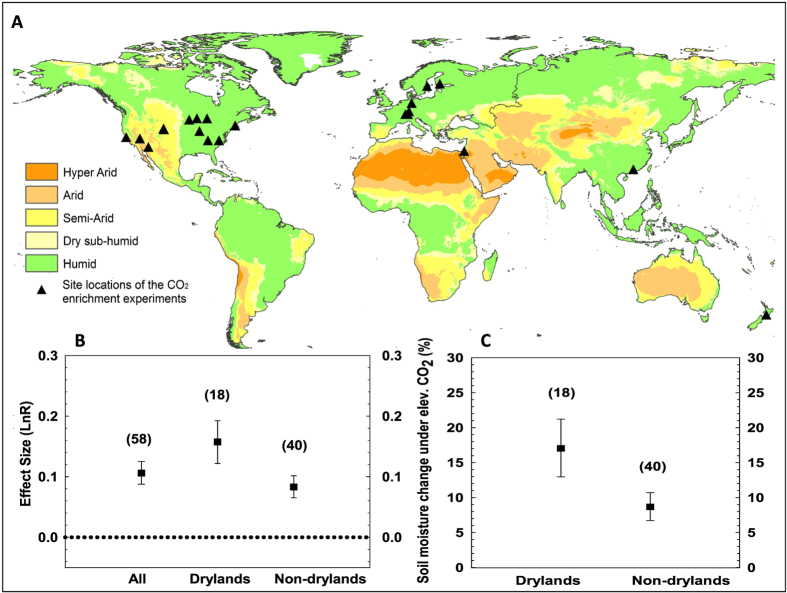
Figure 1. Global climate map and a comparison of mean effect size and soil water response under elevated CO2.
(A) Site locations of the CO2 enrichment experiments together with globally distributed climate zones based on a standard aridity index formulation (precipitation/potential evapotranspiration); (B) Mean effect size of soil water content under elevated CO2 for the entire data set, under dryland and non-dryland regimes. The effect size was calculated as the natural log of the magnitude of an experimental treatment mean (the soil water under elevated CO2) relative to the control treatment mean (the soil water under ambient CO2); The dashed line indicates the threshold of statistically significant CO2 effect on soil moisture. The effect is positive when above the line and vice versa. (C) Enhancement of soil water content under elevated CO2 for dryland versus non-dryland regimes. The number of cases is shown in brackets. Error bars are bootstrapped confidence intervals (CI). All the statistics are significant at P < 0.05. The map was generated using ArcGIS for Desktop 10.3.1 (http://www.arcgis.com).

