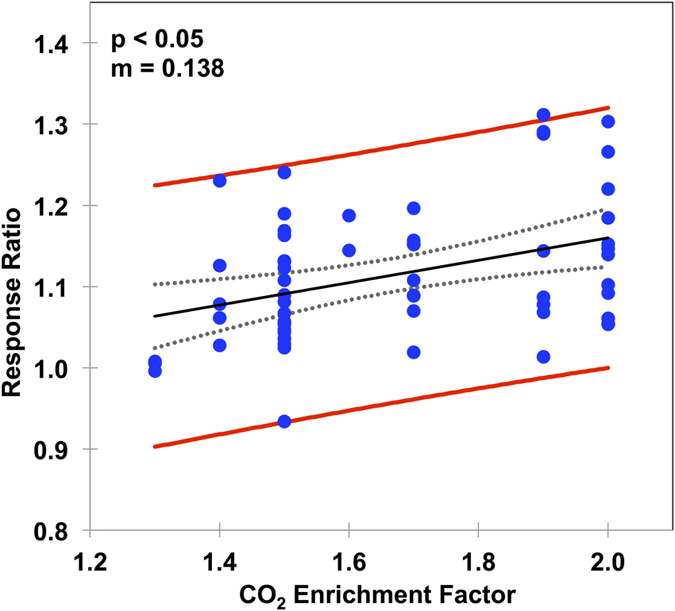
Figure 4. Sensitivity of the soil water response to CO2 enrichment for the entire data set.

The response index was calculated as the soil water content under elevated CO2 divided by the soil water content under ambient CO2. The closed circles are the observations, with the solid black line providing a linear regression. The red lines represent the 95% confidence intervals of the observations and the dashed grey lines represent the 95% confidence interval of the model. m is the slope of the regression line.
