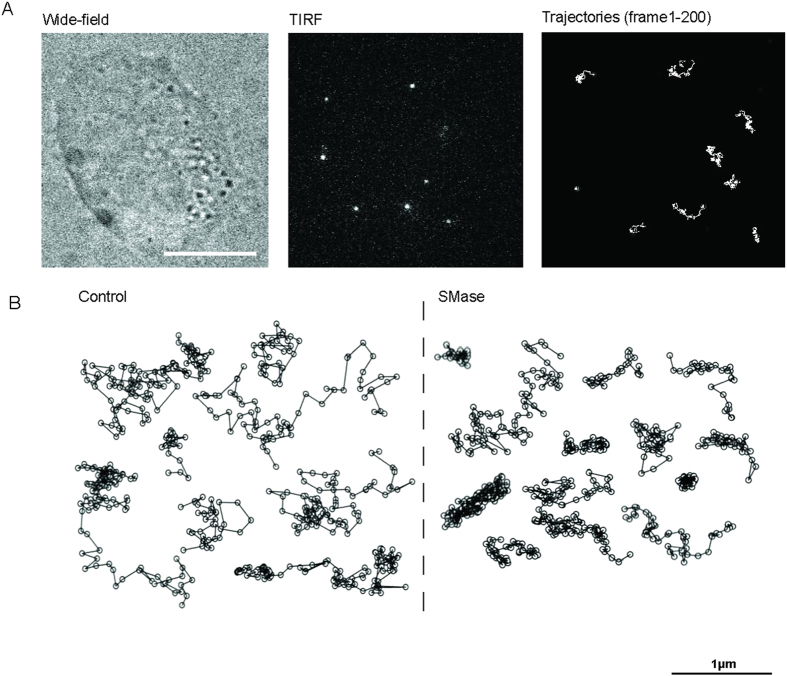
Figure 2. Trajectories of LFA-1 nanoclusters are visually affected by SMase.
(A) Widefield image of a living THP-1 cell (left) and selected frame from a movie recorded at 100ms/frame in TIRF mode (middle). Bright spots correspond to individual LFA-1 nanoclusters labeled with TS2/4-Atto647N. Examples of different trajectories as they are tracked on the cell membrane of THP-1 cells over 200 frames (right). Scale bar: 10 μm. (B) Representative trajectories of LFA-1 nanoclusters in unperturbed (left) and SMase (right) treated cells, illustrating different lateral mobilities.

