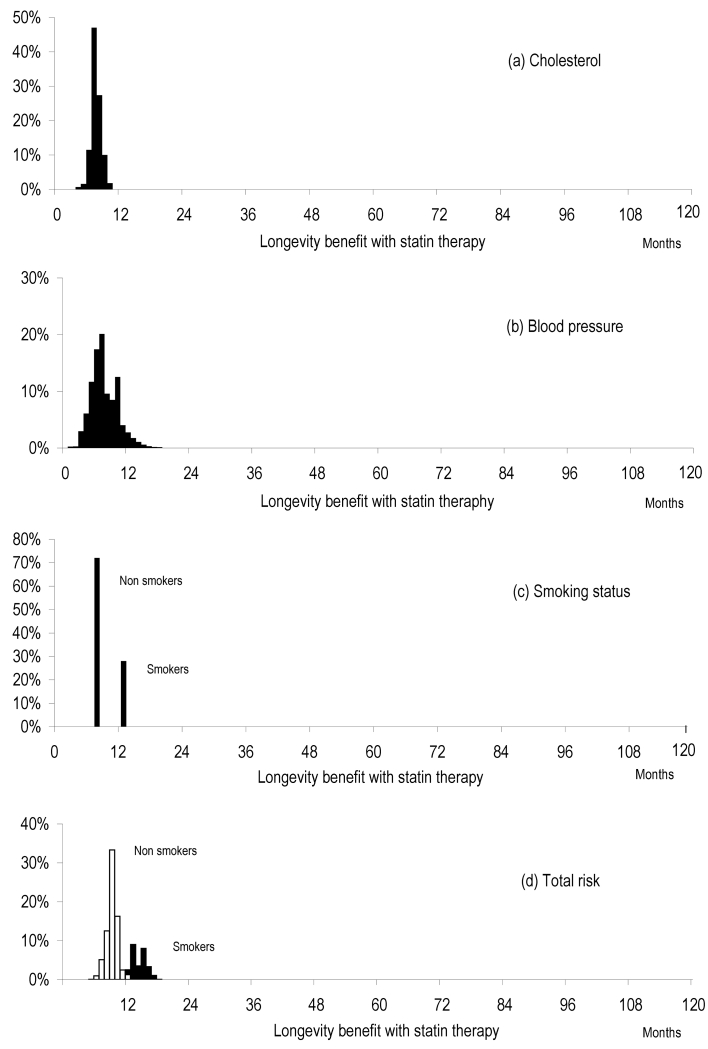
Figure 5. Expected distribution of longevity benefit in the English population.
Distribution of longevity benefit with statin therapy resulting from distribution of a) total serum cholesterol b) systolic blood pressure c) smoking in the general population with all other risk factors held constant. 4 d) shows the distribution of longevity benefit for total cardiovascular risk using all 3 variables combined in an aggregate risk score using the SCORE algorithm.21

