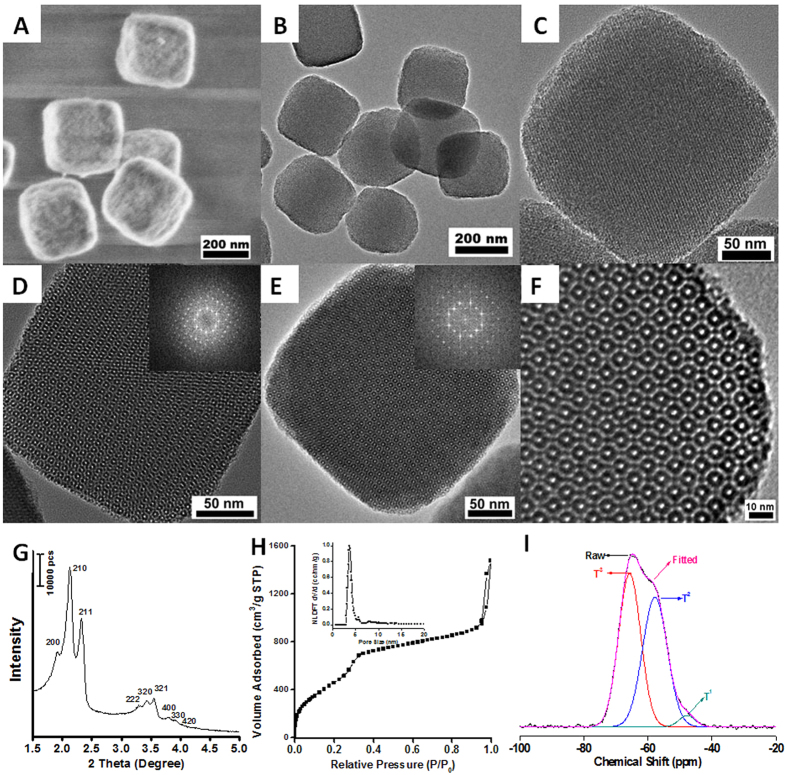
Figure 1. The characterization of the typical PMO nanocubes with a size of 200 nm.
FESEM (A), TEM (B–F) images, small-angle XRD patterns (G), nitrogen adsorption-desorption isotherms (H) and the corresponding NLDFT pore size distribution plots (inset H), 29Si MAS NMR spectra (I). The HRTEM images (C–E) are viewed from (210), (110) and (100) planes, respectively. Insets (C,D) and (E) are the corresponding fast Fourier transform (FFT) of the TEM images.

