
Figure 3. Image of Visualized Genome on Chromosome scale using GMOL.
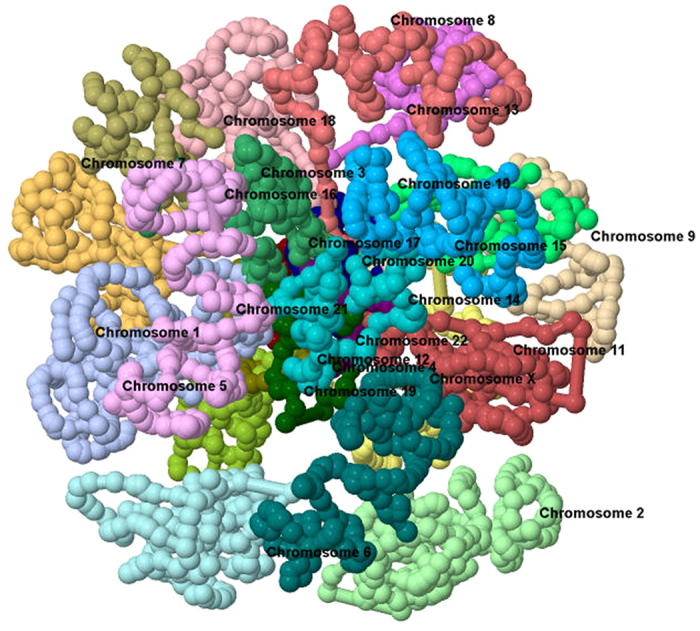
Extracted image of a resulting 3D genome structure visualized in GMOL, in the chromosome scale. Here each chromosome within the genome is highlighted with a different color and labeled for identification. The visualization is from a genome previously modeled16.