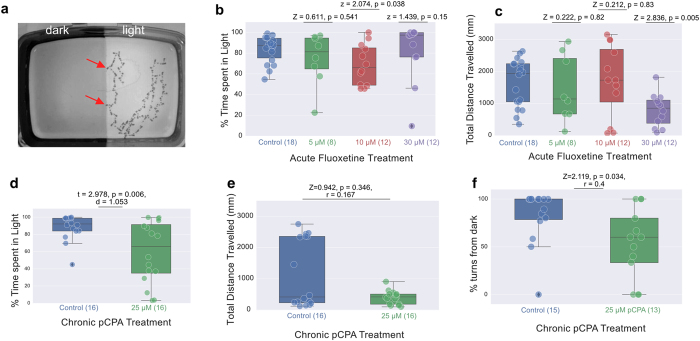
Figure 1. Effect of pharmacological manipulation on light preference.
(a) An example of larval zebrafish behaviour when given a choice between light and dark zones in a tank. The image shows the trace of 1 fish, over a period of 66.7 seconds. Traces were obtained by minimum projection of a t-stack consisting of recordings made at 12 frames/second under infrared incident illumination. The fish remained within the light zone. When it approached the border (arrows), it turned back into the light. (b, c) The effect of three different concentrations of fluoxetine on light preference, as shown by percentage of time spent in the light (b) and distance travelled (c). The highest concentration used caused a reduction in locomotion, but did not reduce preference for the light. (d,e) pCPA caused a reduction in percentage of time spent in the light (d) and in distance travelled (e). Fish that approached the dark turned away less frequently following exposure to pCPA (f). Fish that never approached the boundary between light and dark were excluded from turn frequency analysis. In panels b-f, box plots are drawn such that the box extends between the lower (25%) and upper (75%) quartiles of the data with a line at the median. The whiskers represent the distribution of the data. Each circle represents data from individual fish and circle with black diamonds show the outliers. For distributions of data not satisfying the normality test, p-value was obtained using the Wilcoxon Rank Sum Test (Z is the test statistic, r is the non parametric effect size, panels b,c,e,f) else an independent T-test (t is the t-statistic, d is Cohen’s d, panel d) was used. Statistical comparisons were always made between control fish and drug treated fish. Number of fish in each condition is provided within brackets on the x-axis.

