Fig. 2.

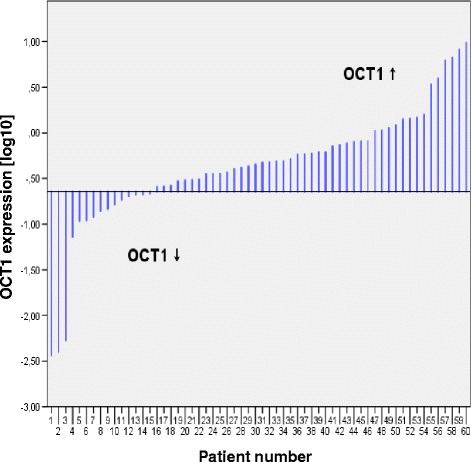
Intratumoral OCT1 expression according to median. The patients were sorted by intratumoral OCT1 expression (n = 60). Two patient groups were defined according to the lower quartile of intratumoral OCT1 expression

Intratumoral OCT1 expression according to median. The patients were sorted by intratumoral OCT1 expression (n = 60). Two patient groups were defined according to the lower quartile of intratumoral OCT1 expression