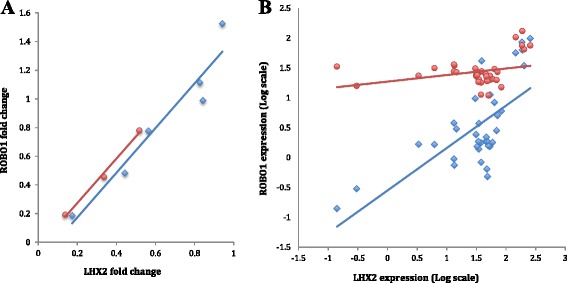
Fig. 6.

Correlation between ROBO1 and LHX2 expression. a LHX2 was knocked down by lentiviral shRNA constructs in lymphoblast cell lines extracted from the DYX5-linked family and from control individuals. Expression levels of LHX2 and ROBO1 were measured by quantitative real-time PCR. The fold-change values indicate the difference between LHX2-shRNA and the control scramble shRNA-treated cells. Blue indicates the DYX5-linked family and red indicates controls. The regression lines show that low expression of LHX2 correlates with low expression of ROBO1. b ROBO1 and LHX2 expression in 22 different brain tissues from the FANTOM5 database. The red dots and lines show the co-expression between LHX2 and ROBO1 shorter splice variant b. The blue dots and lines show the co-expression between LHX2 and ROBO1 longer splice variant a
